Roundup: Under the Hood of CPI Inflation
Zack Morris | Research Analyst
May 16, 2024
Inflation: What Gets Measured Gets Managed
There has been much debate in 2024 in financial circles as to whether we are experiencing a rebound in inflation here in the US, or merely a pause on a sustained path towards the Fed’s 2% target. It seems that smart people can look at the exact same figures and come to wildly different conclusions — that’s what makes a market!
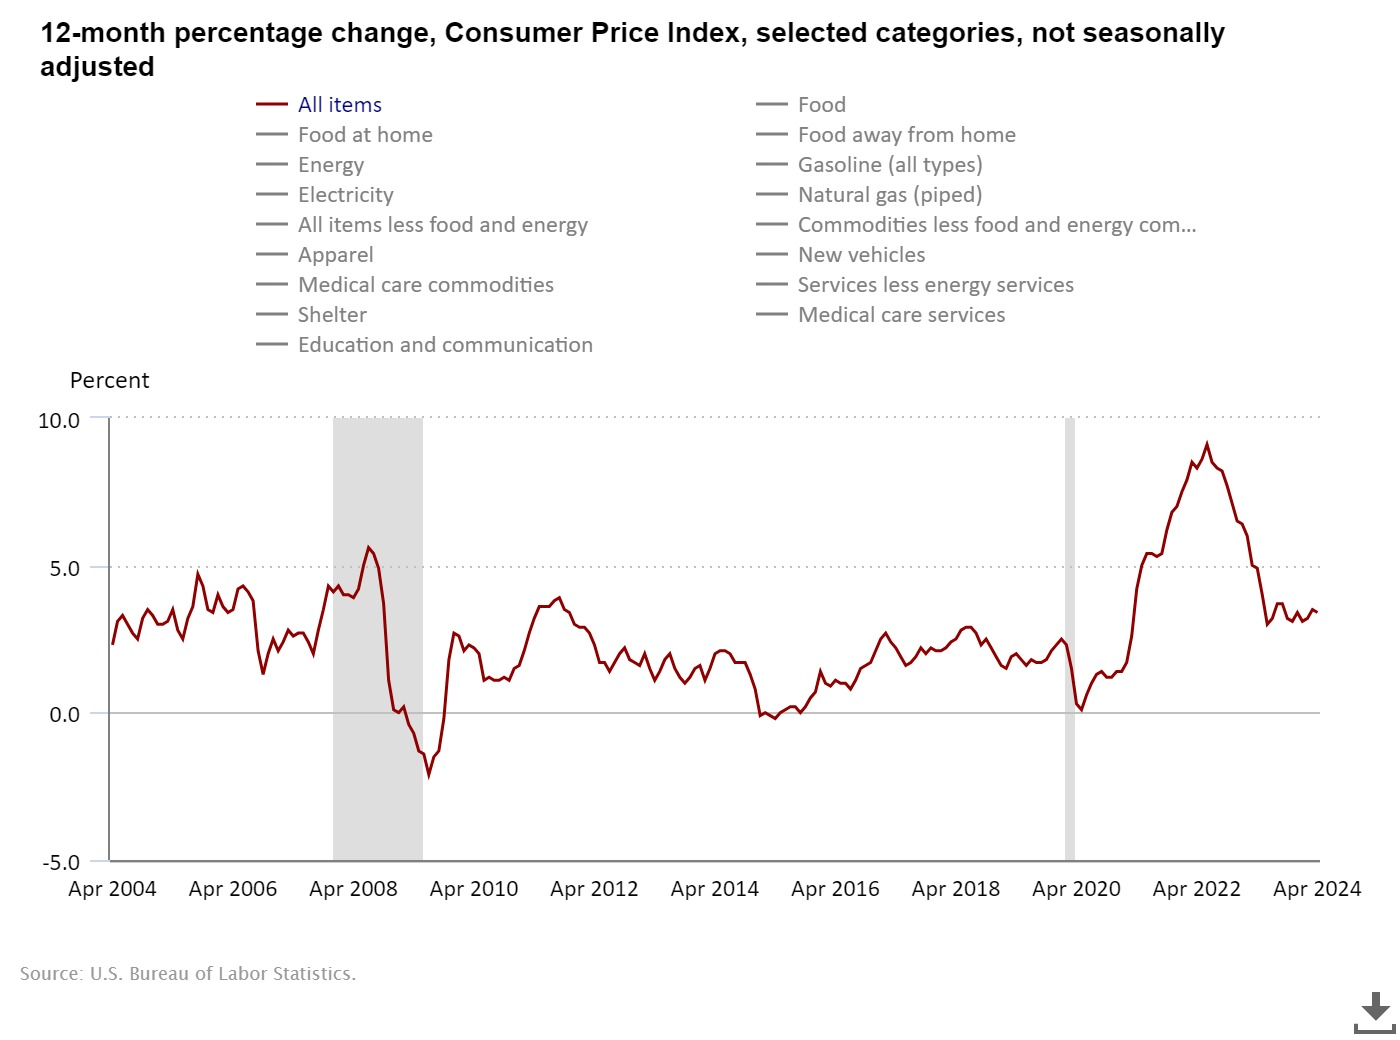
Yesterday morning, the Bureau of Labor Statistics (BLS), responsible for calculating measures of inflation, including the widely quoted and tracked CPI — Consumer Price Index — reported annual CPI inflation of 3.4% for the year ended April 2024.
This is a decline from 3.5% a month ago, and markets responded well to the CPI falling from last month, with risk assets rallying and bond yields falling.
The constantly changing and black-box nature of how CPI is calculated has drawn criticisms. Just this week, for example, it was discovered that the CPI removed coffee from its calculations amid a 28% jump in the price of coffee beans over the last two months. After all, what gets measured gets managed!
Or consider this. The price of ribeye increases at your local grocery store to the point where the average consumer can no longer justify steak dinners. Instead, they opt for ground beef. The CPI basket updates to reflect this apparent change in consumer preferences, and substitutes ground beef for ribeye in their inflation calculation. The average grocery bill, and reported inflation, might have decreased, but so did the quality of the food being bought.
On the other hand, to be fair, the 2004 CPI basket didn’t include smartphones or the monthly cost of streaming all the music ever recorded. Advances in technology have given us new products and services over time which (at least arguably!) raise the quality of living.
So, with the caveats that CPI needs to be taken as one part of a whole picture, and everyone’s personal experience of inflation will depend on their own consumption habits, what’s actually going on beneath the hood with the inflation measures used to set policy?
As mentioned, headline CPI is 3.4%. Rather than having “rebounded,” I’d call it more of a leveling out. See for yourself:
Policy makers, such as the Fed, prefer to look at “core” inflation measures. Core CPI strips out “volatile” food and energy costs. This measure is considered to provide a more “stable” and “accurate” reflection of underlying inflation trends (nevermind that a significant portion of many consumer budgets is food and energy!).
Core CPI (all items less food and energy) is actually a tick higher at 3.6%.
While it is difficult to predict the future direction of food and energy prices (except perhaps if the price of a certain food group goes up too much, it will be removed from the index!), examining this “core” bucket can give us clues as to the future path of reported inflation and, thus, perhaps also monetary policy and markets.
So what’s going on under the hood with Core CPI?
The following four charts and analysis come courtesy of Michael Green and the excellent Yes, I give a fig Substack.
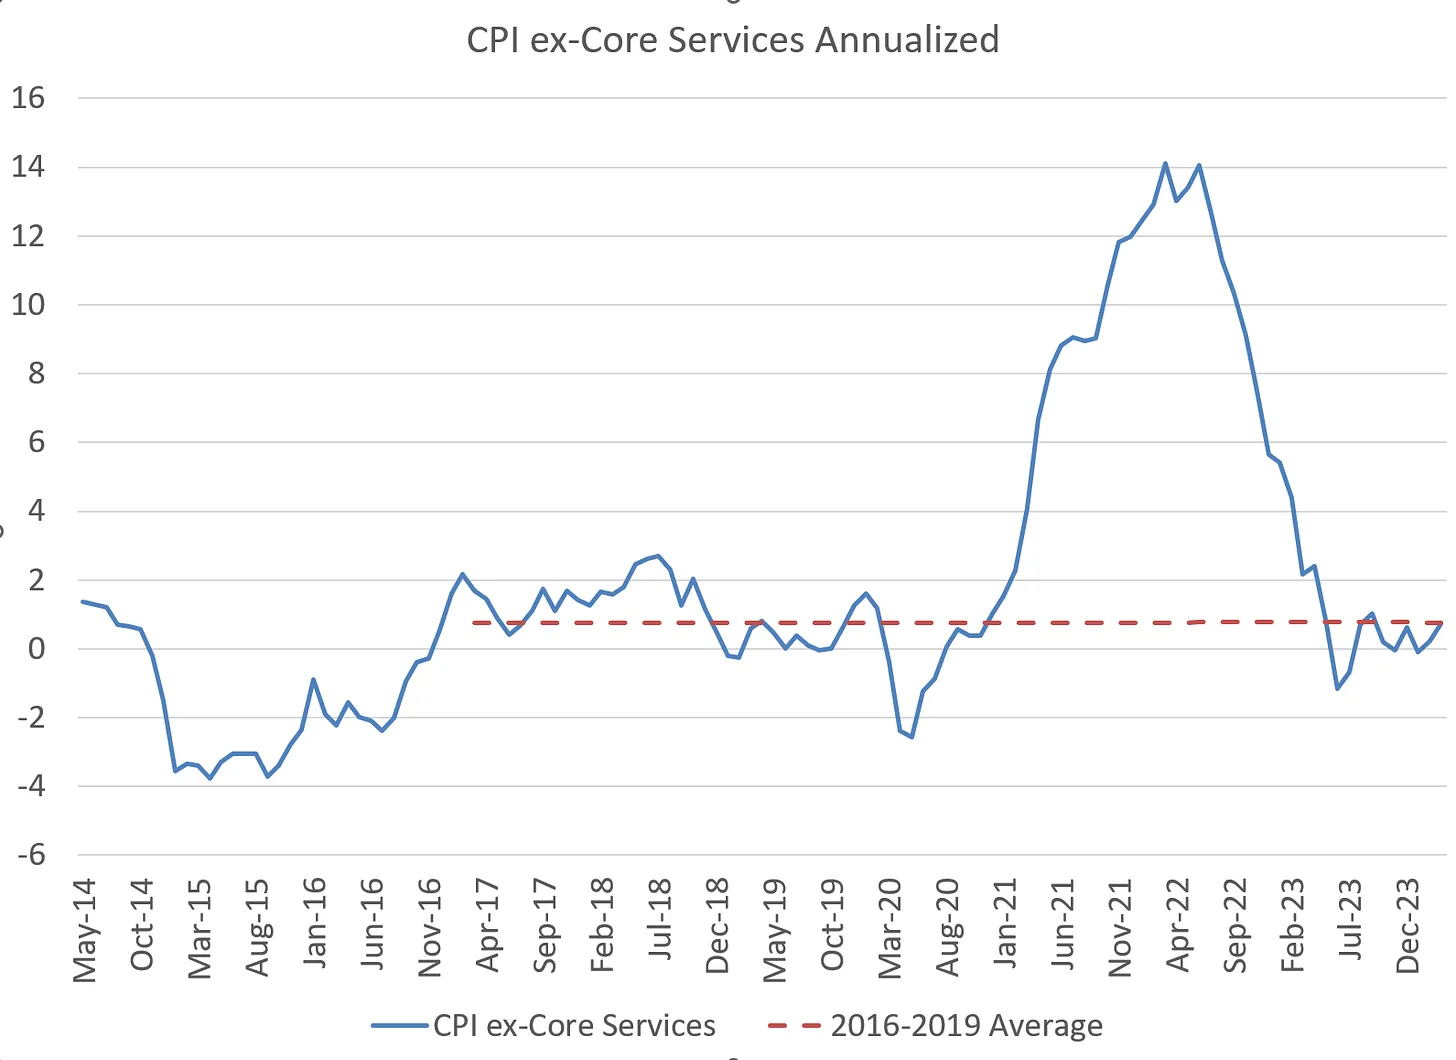
Core CPI can be broken down into Core Services and ex-Core Services (i.e. goods and products).
The first chart shows that CPI ex-Core Services has retreated to sub 2% levels, in-line with the normalized 2016-2019 average. CPI ex-core services accounts for 42% of Core CPI.
Source: Yes, I give a fig… thoughts on markets from Michael Green
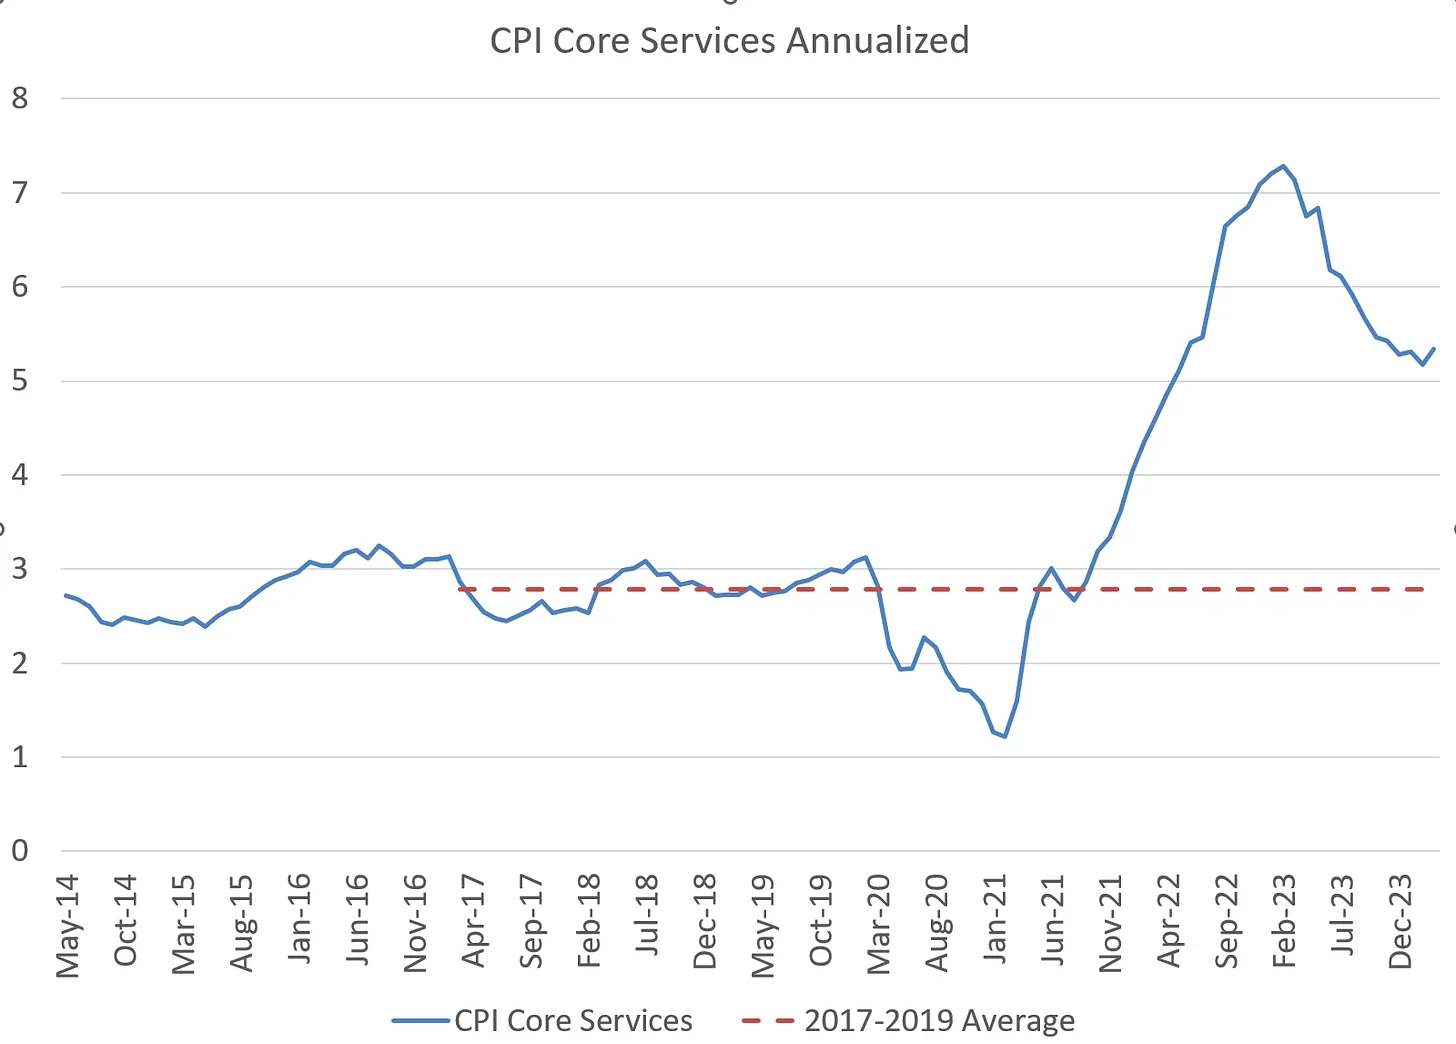
So, from this we can deduce that it is the 58% of the Core CPI made up of these “core services” that must be driving the 3.4% headline CPI number.
And indeed, CPI Core Services is currently running at over 5% annualized, vs. a 2.8% normalized, pre-pandemic average:
Source: Yes, I give a fig… thoughts on markets from Michael Green
So what’s driving the inflation in core services?
Just as Core Services makes up 58% of Core CPI, Shelter makes up 58% of Core Services (making Shelter 58% x 58% = 34% of Core CPI).
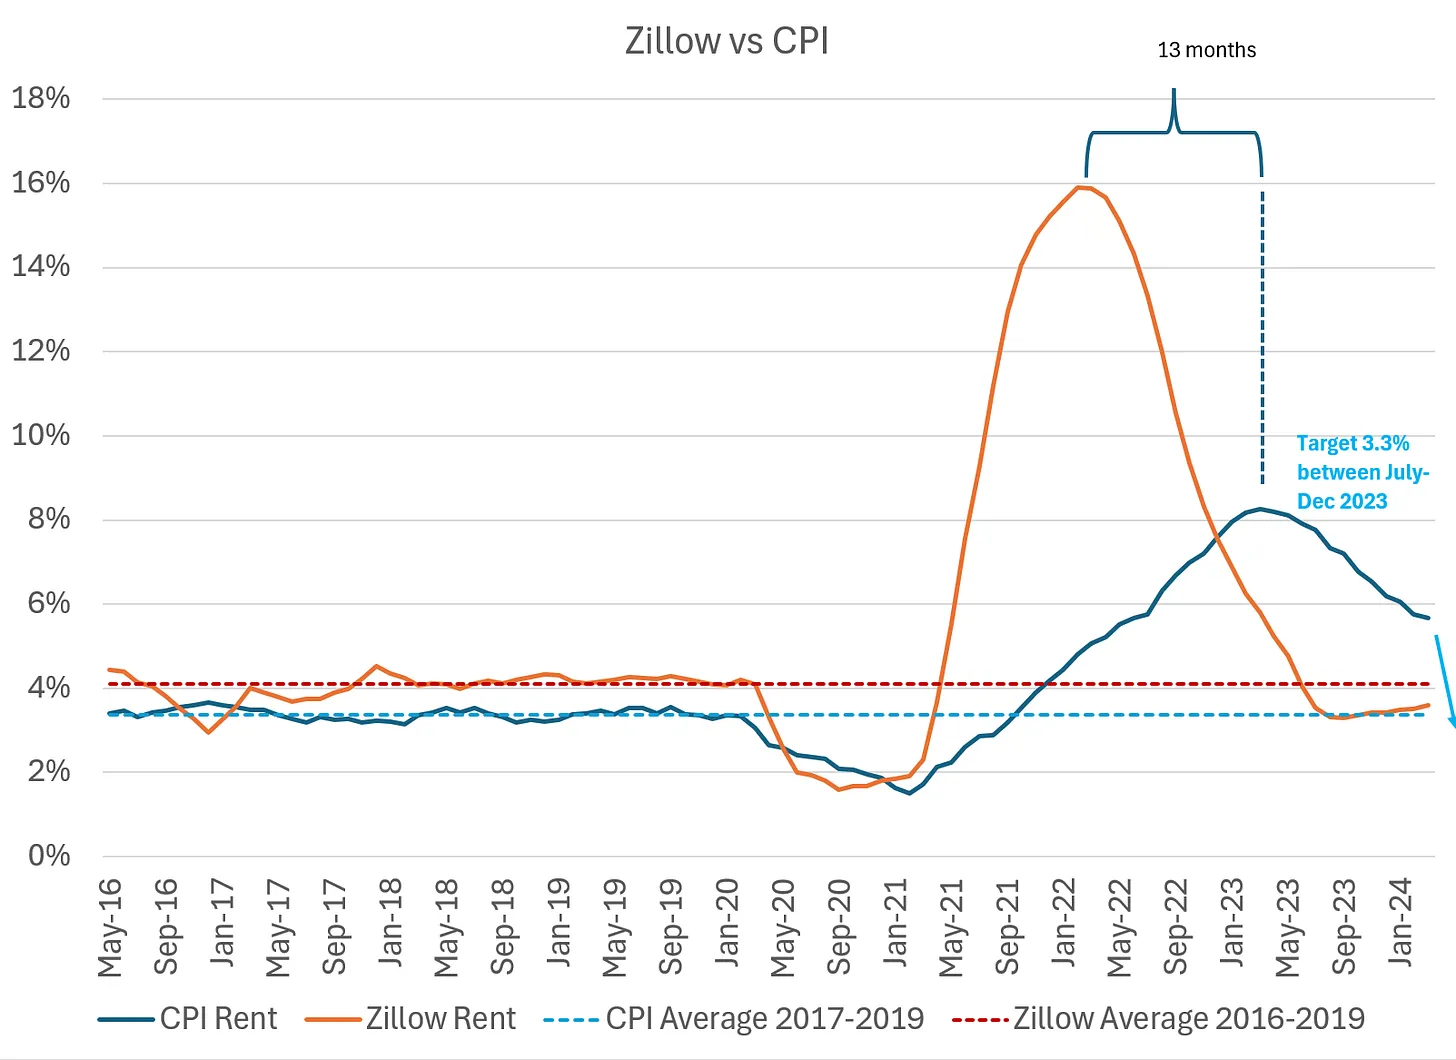
So what’s happening with rent? The CPI measure of rent is a notoriously lagging indicator vs. real-time measures such as the Zillow Rent Index. Knowing this gives us clues into the future path of headline CPI.
As the chart below shows, CPI rent lags real-time rents by about 13 months. This means that we can expect CPI rent to continue declining and to bottom around October 2024, 13 months after the Zillow Rent Index bottomed.
Source: Yes, I give a fig… thoughts on markets from Michael Green
Judging by pre-pandemic trends, we can expect CPI rent to ultimately bottom out about 0.5% lower than than the 2017-2019 average, so call it 2.5%.
So shelter, which accounts for 34% of Core CPI, falling from its current shade under 6% to somewhere in the neighborhood of 2.5%, is already baked in the cake. This is going to be a significant headwind to reported CPI inflation for the rest of 2024.
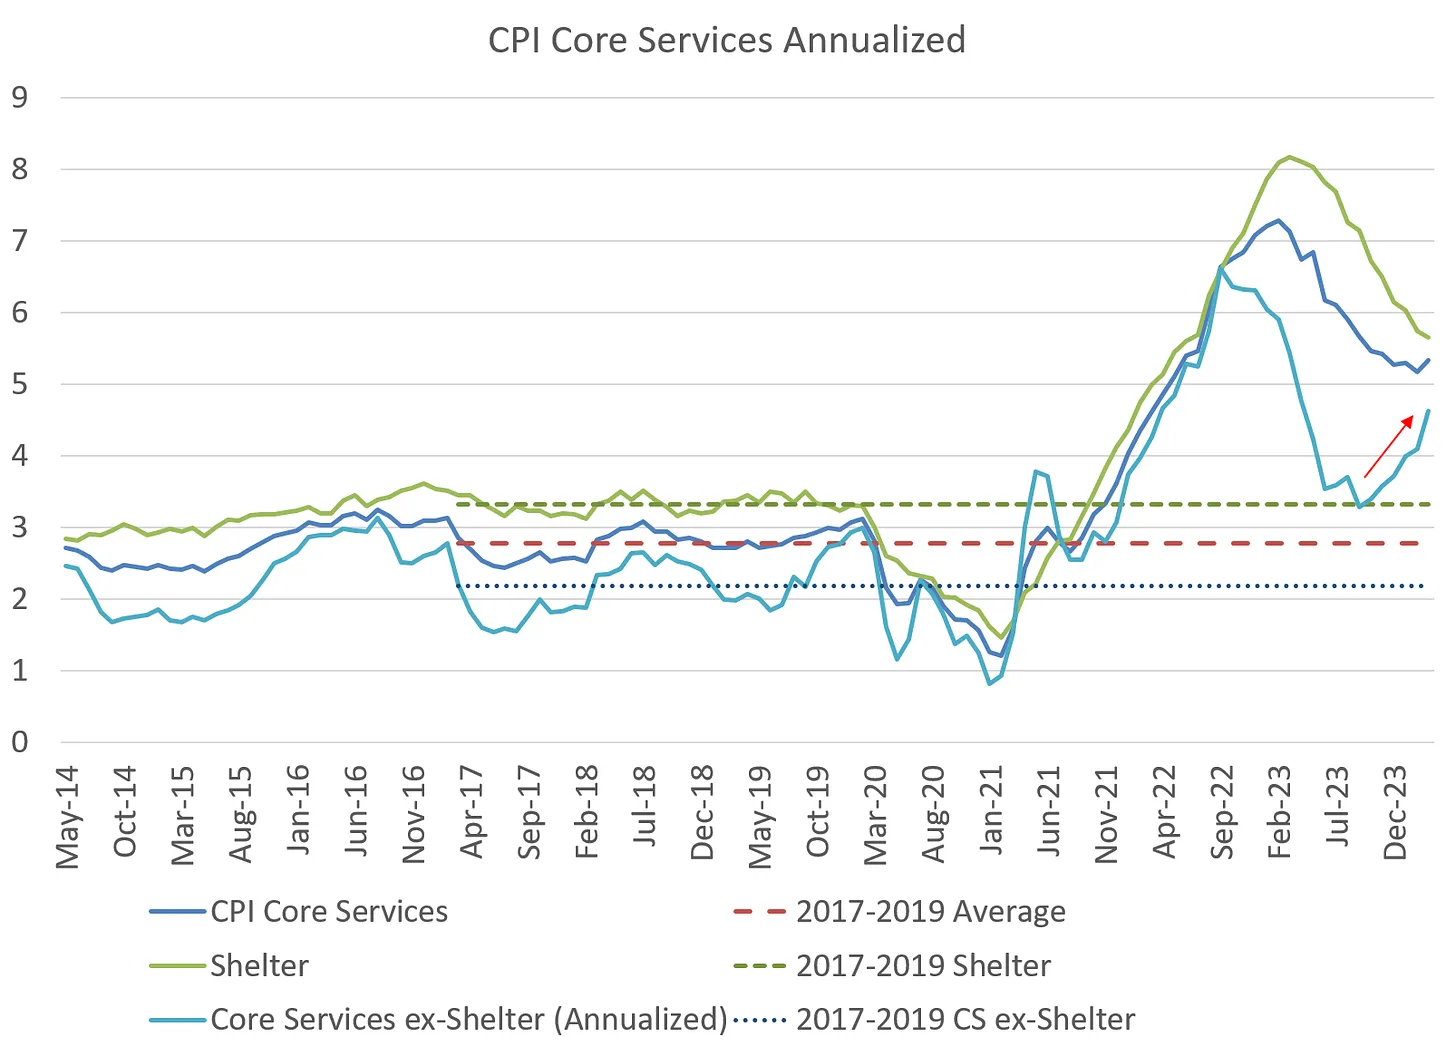
So if rent inflation makes up 58% of the pesky core services which are keeping CPI elevated right now, and it is falling, the 42% of core services ex-rent must be up on a pogo stick, right?
This, again, is what we observe:
Source: Yes, I give a fig… throughts on markets from Michael Green
The teal line above shows core services ex-shelter actually rebounding from 3.5% to nearly 5% in the first quarter.
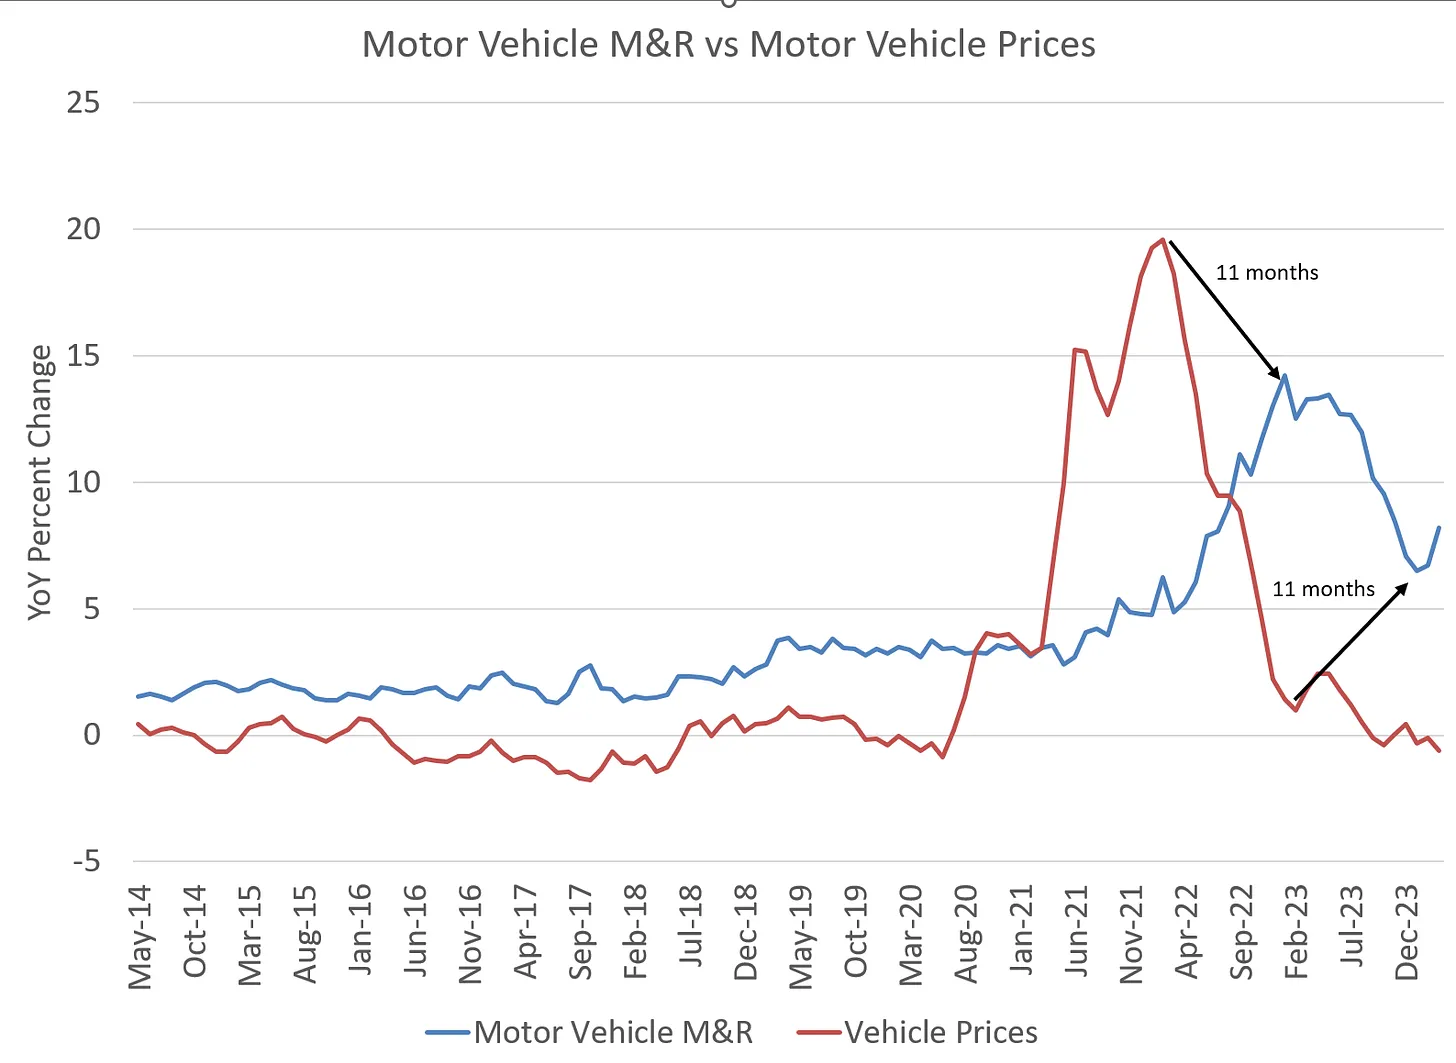
This has been driven by an increase in the price of car insurance and vehicle maintenance and repair, which lag used car prices.
Which…have already come down to negative year-over-year:
Source: Yes, I give a fig… thoughts on markets from Michael Green
So, in summary:
- The basket of goods and services used to calculate CPI consists of Food (~14%), Energy (~7%), and Core (all items less food and energy, ~79%).
- Policy makers, such as the Fed, prefer to look at measures of “Core” inflation, as food and energy prices are deemed to be volatile and not easily influenced by monetary policy.
- Core CPI consists of Core Services (~58%) and non-Core Services (goods and products, ~42%).
- Non-Core Services inflation has already fallen to pre-pandemic levels of about 1%.
- Core Services inflation remains stubbornly high at ~5.5%, but measures of 1) rent and 2) motor vehicle insurance, maintenance and repair, which both lag real-time price measures by about a year, are likely to come down.
- Rent, accounting for 58% of Core Services, is especially likely to act as a headwind to headline CPI for the remainder of 2024.
What’s Old Is New Again: Zimbabwe Launches Gold-Linked Currency
In its latest bid to attempt to arrest hyperinflation that has plagued the nation since 2008, the Zimbabwe central bank has launched a brand new fiat currency linked to gold called ZiG, short for Zimbabwe Gold.
The new currency was announced on April 5th and electronic transacting in the new currency unit began three days later on April 8th. Notes were put into circulation on April 29th. The entire Zimbabwe stock exchange was redenominated in ZiG as well as part of the transition. The exchange rate was 13.56 to the US dollar at launch, and is now being quoted at 13.41 to the dollar, having strengthened slightly.
The official currency of Zimbabwe before the transition was the Zimbabwean dollar, although much of the economy had already switched to using US dollars as the Zimbabwean dollar had lost 80% of it’s value against the USD in just the first 3 months of 2024. All holders of Zimbabwean dollar accounts had their balances converted to the new currency. The US dollar is still being allowed to circulate and is being accepted as payment.
The new currency is backed by $185 million in gold and $100 in cash reserves, so it is not backed by gold 1:1. To spur demand, the government is going to require that at least 50% of tax obligations be settled in ZiG.
While seemingly so far away from the day-to-day experience of much of the developed world, reflecting on the whole episode of dealing with hyperinflation, needing to adopt another country’s currency out of necessity, and introducing a new currency to an economy on the fly in the year 2024 is a chance to at least attempt to consider a different perspective from your own while trying to understand money, financial freedom, and, in turn, bitcoin.
Much of the world’s population is unbanked, even more deal with an unstable local currency, and even more could only dream of access to the S&P 500. They are forced to save in physical cash or illiquid and depreciating store-of-value assets like cars or houses. For them, bitcoin is much more than a “speculative asset” — it might be the only liquid, durable, functional savings technology accessible to them.
Wisconsin Gets Off Zero
The State of Wisconsin Investment Board (SWIB) revealed in a filing that as of March 15 they have purchased shares of BlackRock’s IBIT and Grayscale’s GBTC bitcoin ETFs worth about $164 million.
In total, SWIB manages about $156 billion in assets on behalf of Wisconsin state retirees and the State Investment Fund, meaning their initial bitcoin allocation amounts to about 10 basis points or 0.10% of assets.
While they’re certainly not betting the farm as of yet, according to my research Wisconsin becomes just the fourth public pension fund, and first state pension fund, to reveal an investment in bitcoin and the first through the ETF vehicle. The Fairfax County Police Officers Retirement System and the Fairfax County Employees’ Retirement System began investing in bitcoin in 2019, and the Houston Firefighters’ Relief and Retirement Fund made an investment in bitcoin in 2021.
As institutional investment in the asset becomes normalized and adoption and education spreads, expect more states to follow in Wisconsin’s footsteps. Their investment is a piece of evidence refuting the claim that “everyone who wants to allocate to bitcoin has already had ample opportunity to do so,” and shows that, despite significant trade-offs relative to Multi-Institution Custody, the ETF wrapper, over time, is likely to unlock a wave of institutional investment capital to come into bitcoin.
Chart & Quote of the Week
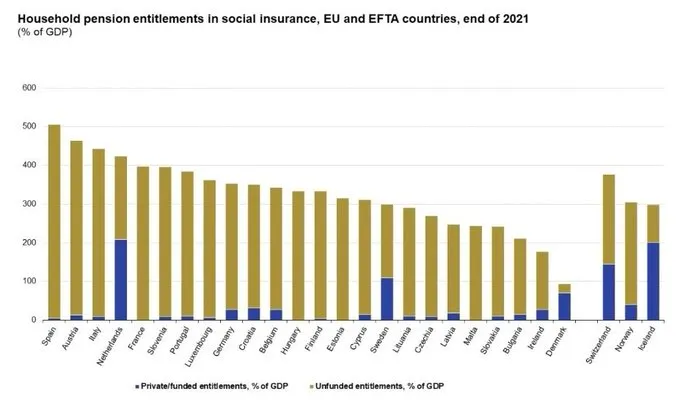
“That‘s the most scary chart I have seen in a while. Unfunded pension entitlements in major European countries between 300% and 500% of GDP. Mixed with collapsing demographics it’s a recipe for debt disaster.”
Market Update
as of 5/15/2024:
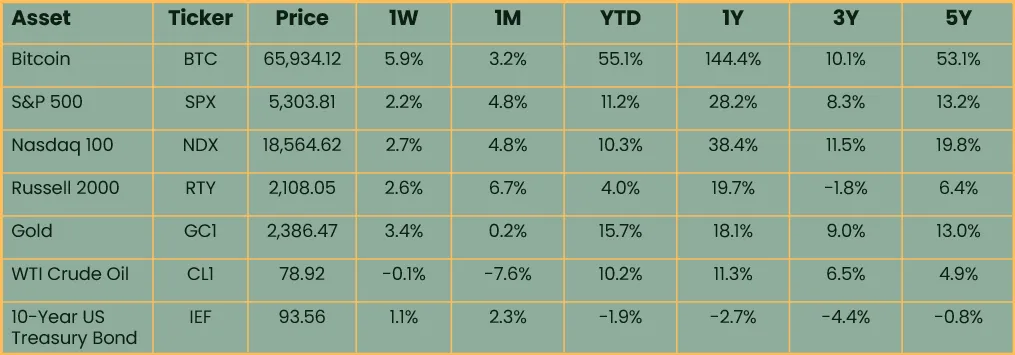
Source: Onramp, Koyfin. 3-, 5-year figures annualized.
Risk assets and bonds sustained a second straight week of gains on the back of weak employment data last week coupled with a benign CPI report yesterday. Markets currently seem to be factoring in the potential for easier monetary policy more aggressively into asset prices than any signs of deterioration in the economy.
Bitcoin rallied 5.9% and was the best performing asset for the second week in a row, perhaps buoyed by news of large institutional allocations to bitcoin ETFs revealed in 13-F filings. The S&P 500 and Nasdaq 100 pierced new all-time highs yesterday as wild trading in meme stocks again took center stage. Oil continued to lag, keeping a lid on inflation expectations. Gold rallied and bond yields continued to retreat from their year-to-date highs, driving bond prices higher.
Podcasts of the Week
The Last Trade E049: Invert, Always Invert with Fidelity’s Chris Kuiper
In this episode of The Last Trade, Chris Kuiper, Director of Research at Fidelity Digital Assets, joins to discuss ETF flows & buyers, reflexivity of demand, bitcoin’s volatility, post halving supply dynamics, game theory of adoption, & more.
Scarce Assets E010: Vijay Boyapati – Bitcoin’s Bullish Case
In this episode of Scarce Assets, author Vijay Boyapati joins the pod to discuss corporate bitcoin adoption, bitcoin’s monetization path, hype cycles & bull market phases, industry maturation, bitcoin development, scaling layers, & more.
Closing Note
Onramp provides bitcoin investment solutions built on top of multi-institution custody. To learn more about our products for individuals and institutions, schedule a consultation to chat with us about your situation and needs.
Find this valuable? Forward it to someone in your personal or professional network.
Until next week,
Zack Morris
