Roundup: New On-chain Metrics in The Onramp Terminal
Zack Morris | Research Analyst
Jul 25, 2024
Onramp Bitcoin Terminal
The Onramp Bitcoin Terminal is your one-stop shop for bitcoin fundamentals, on-chain research, and real-time aggregated trending news topics from around the industry.
Onramp recently rolled out 20 new on-chain metrics for investors to reference and utilize in their investment process. Today we’re going to look at a few and analyze what they tell us about the current market environment.
Spent Output Profit Ratio (SOPR)
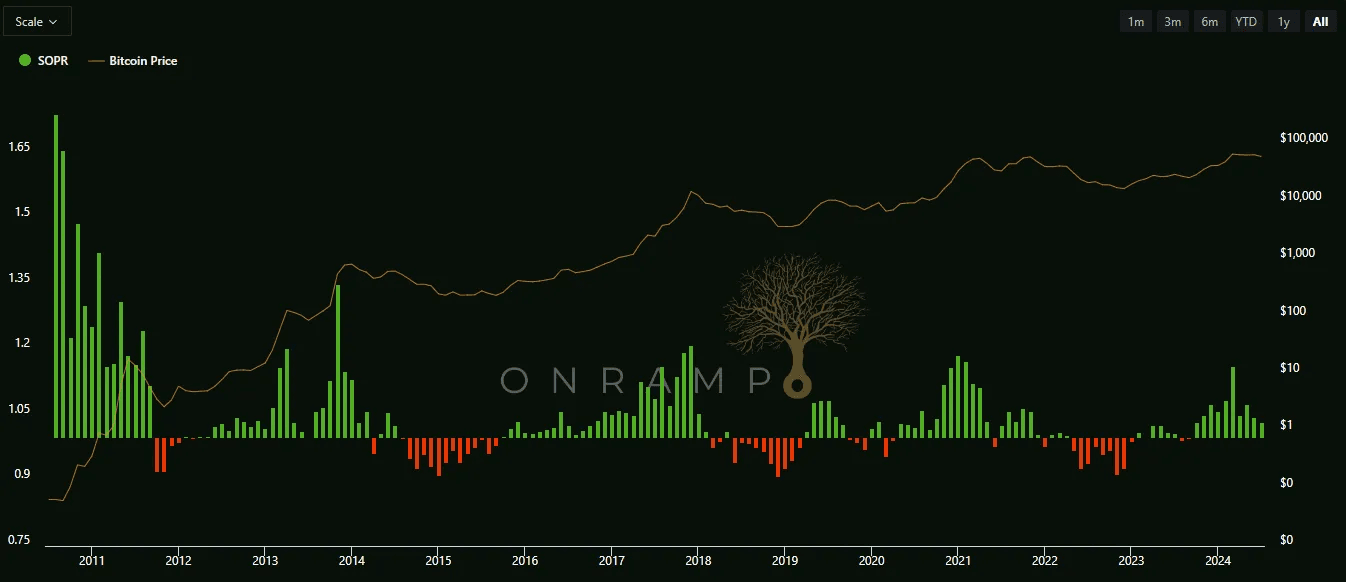
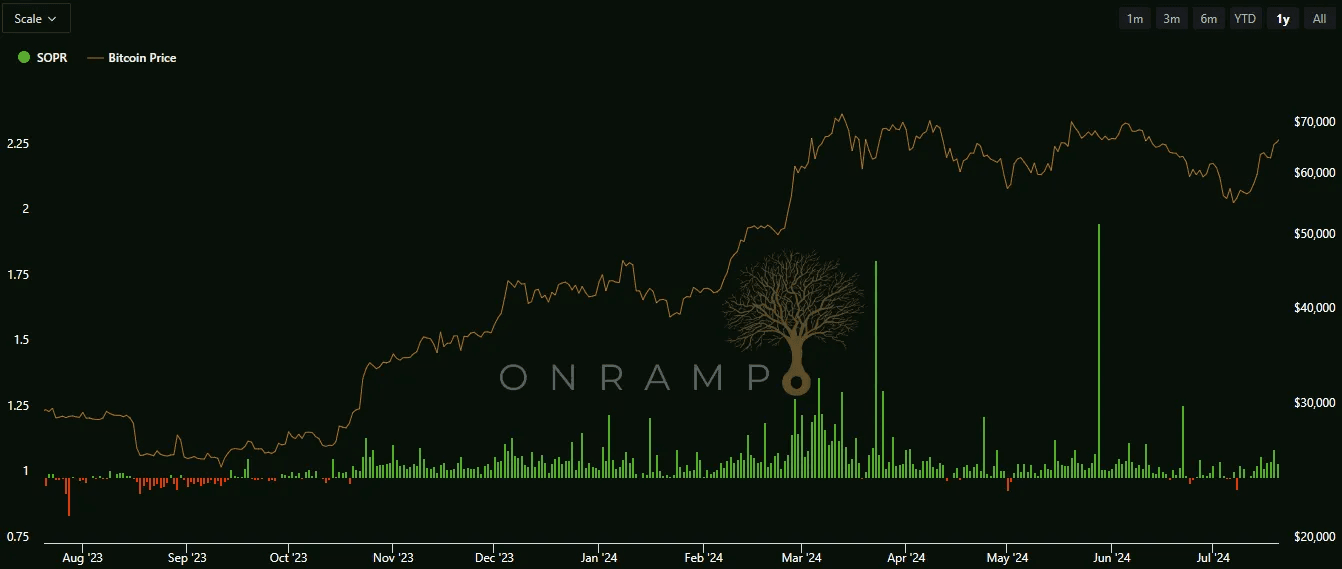
Spent Output Profit Ratio (SOPR) measures the fiat value comparison between bitcoins currently being moved on-chain, or “spent,” and when they were last moved. Said otherwise, SOPR measures the ratio of the price sold / price paid.
Since a large volume of buying and selling takes place on exchanges, and also sometimes users will transfer bitcoins to themselves, SOPR is not a perfect measure of buyer and seller economic activity taking place on the Bitcoin network. However, it is directionally correct and has been a useful indicator of market tops and bottoms.
Market tops have coincided with the monthly SOPR peaking above 1.2, meaning that coins being moved on-chain are on average 20% more valuable, in fiat terms, than the last time they were moved. Said otherwise, spenders were 20% in profit on the coins they were spending. This is indicative of long-term holders taking profits and distributing coins at cycle highs.
On the flip side, bear markets have typically bottomed with the monthly SOPR falling to 0.91, meaning that spenders were capitulating and taking a 9% loss on average.
The top chart above shows the monthly SOPR over bitcoin’s history, and illustrates SOPR’s relationship with major cycle tops and bottoms.
The bottom chart shows a more granular view of the daily SOPR over the last year. It shows that we’ve been in a profitable distribution phase since October 2023 and that daily SOPR did indeed start registering above 1.2 in the March run-up to new all-time highs, although the March monthly SOPR was 1.16.
The 1-year chart also shows that daily dips below 1.0 have been reliable signals of investor capitulation and have marked local bull-market bottoms. Since May, we have been oscillating in the 1.0 – 1.1 range, indicating that the bull market has yet to reach its euphoria phase where it typically registers several consecutive monthly SOPRs in the 1.15 – 1.20 range.
Realized Price
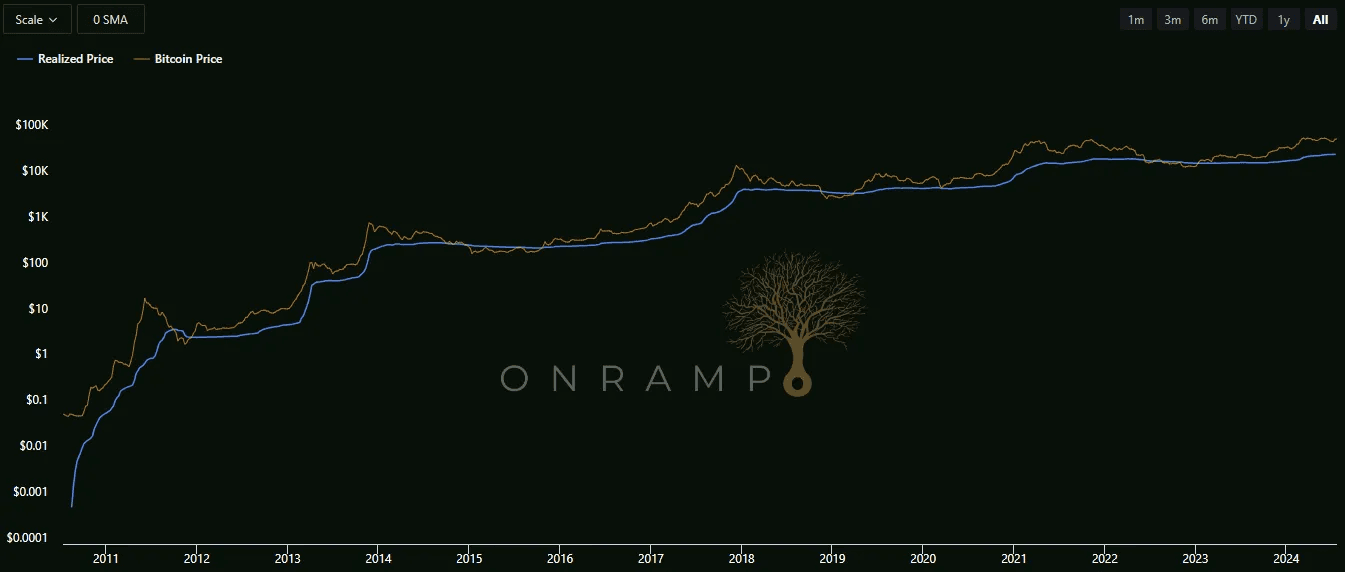
Realized Price measures the average on-chain cost basis of all coins in circulation. As can be seen on the chart, price has always fallen below realized price during bear market bottoms, meaning that in aggregate bitcoin holders are underwater on their purchases. As such, realized price is arguably most useful to investors in predicting market bottoms. If price hasn’t fallen below realized price during a bear market yet, there is likely still more pain ahead.
Realized price has historically also experienced its own parabolic rise during blow-off tops. Although the realized price sits today at an all-time high of $31,053, the relatively flat trajectory of realized price so far in this bull market suggests we have not yet experienced the exuberance of a market top. The previous cycle peak in realized price was $24,636.
A metric that expands upon, and adds more signal to, realized price is the MVRV Z Score.
MVRV Z Score
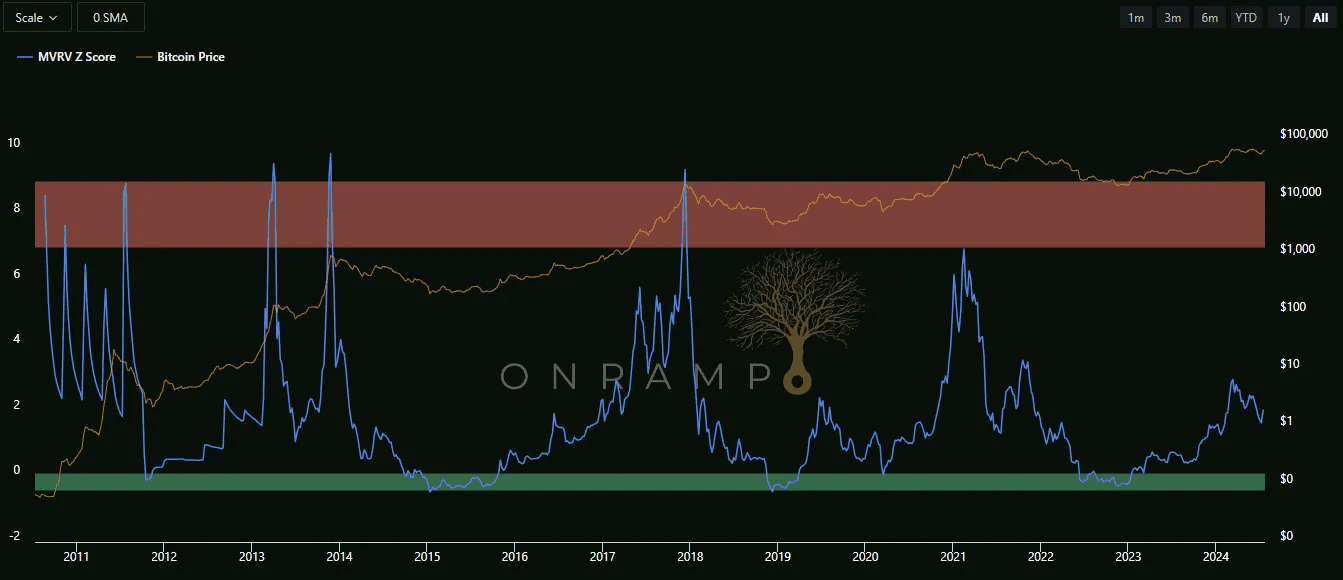
Market Value to Realized Value (MVRV) Z Score normalizes the ratio between bitcoin’s market value and realized value.
As illustrated on the chart, periods where the MVRV Z Score has crested above 6 have indicated major market tops, as marked by the red zone. Likewise, periods where the MVRV Z Score has gone negative (meaning market price has dropped below realized price, as discussed in the section above) have indicated major market bottoms, as marked by the green zone.
Markets are always adapting, and it is likely that this indicator will lose some its historically high signal over time. However, taken in its proper context and adjusting for new information and exogenous factors, this is my single favorite on-chain metric to monitor where we are in the cycle.
The Onramp Bitcoin Terminal allows you to set email alerts for when your favorite metrics cross over certain thresholds, an extremely valuable tool. I have alerts set for when MVRV Z is greater than 6 and MVRV Z is less than 0.
Long-Term Holder Supply
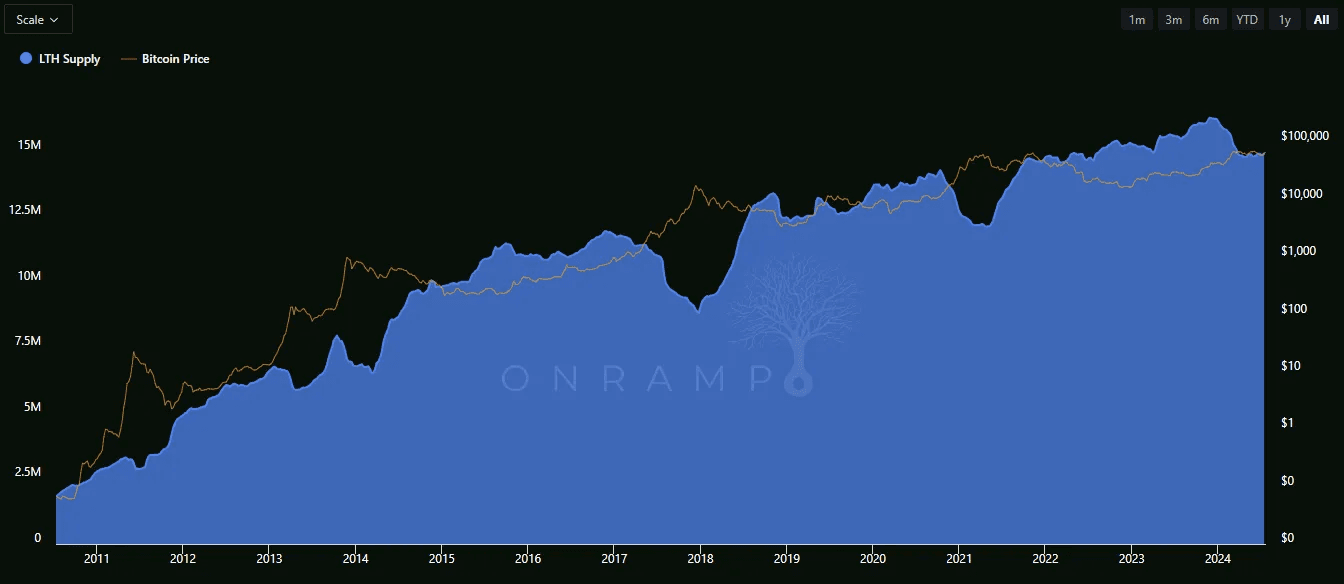
Long-Term Holder Supply refers to the amount of Bitcoin held by investors who have held their coins for more than 155 days. These holders are often seen as having strong conviction in Bitcoin’s future value and are less likely to sell during market volatility.
As you can see on the chart, LTH Supply typically experiences a sharp drawdown coinciding with market tops, as long-term holders take profits and distribute their coins. We are currently in the midst of one such LTH distribution phase, which should give investors pause. However, the current drawdown in LTH supply is likely being driven by a couple of factors that are idiosyncratic to the current market.
The first is the conversion of Grayscale’s GBTC from a closed-end trust to an ETF. This allowed a significant amount of bitcoins which were previously locked in the trust to flow out – about 344k BTC by Onramp’s calculations. Second, the Mt. Gox bankruptcy trustee has moved about 50k BTC to exchanges for distribution to creditors, with about 40k BTC more to go eventually.
Still, this only accounts for about 400k of the 1.4 million drawdown in LTH supply. Perhaps there was a large constituency of buyers at the previous 2021 all-time high range of $60k-$70k that was eager to break-even in the new bull market? In any event, the drawdown in LHT supply of the magnitude we’ve seen so far in this cycle has come earlier than in previous cycles and seems to contradict other on-chain metrics as signaling a potential market top. It is a subtle reminder that no two cycles will be the same and there are no catch-all on-chain metrics that can blindly be relied upon to give us perfect insights into the current market.
Net Unrealized Profit/Loss (NUPL)
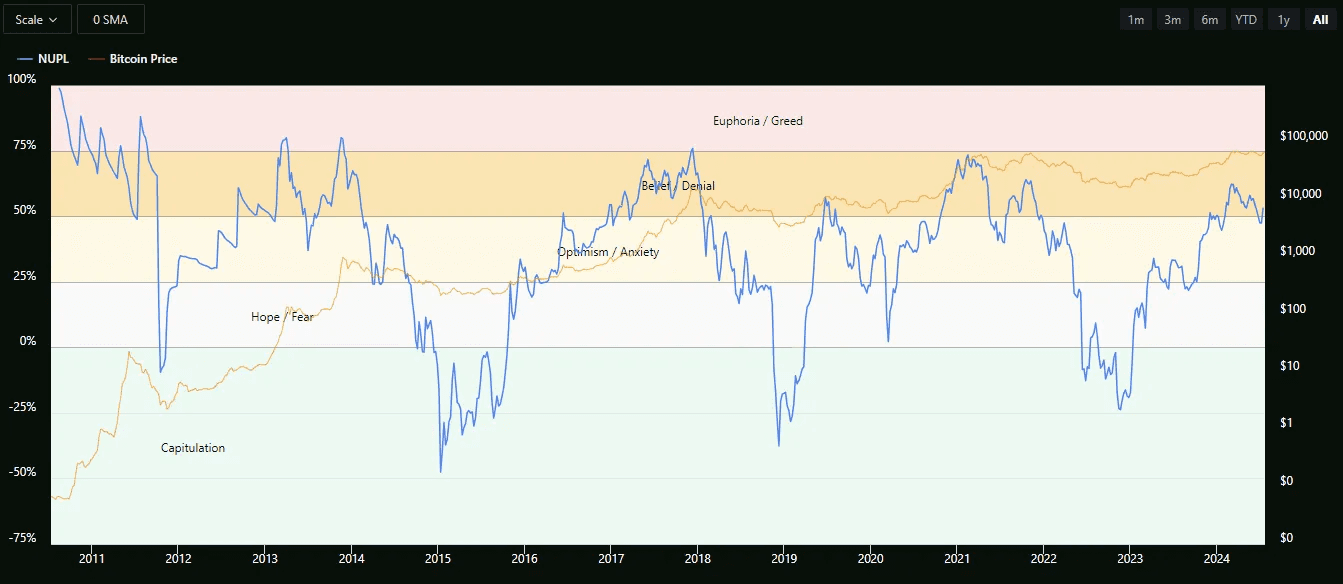
Net Unrealized Profit/Loss (NUPL) is a ratio obtained by dividing the total unrealized gains or losses by the market capitalization of all bitcoins in circulation. Said otherwise:
NUPL = (Market Cap − Realized Cap) / Market Cap
Similar to Realized Price and MVRV Z Score, NUPL goes negative when realized price falls below market price and bitcoin holders in aggregate are underwater. It goes one-step further though in indicating exactly how much pain is being felt — market bottoms have historically formed when holders on average have a 25% unrealized loss on their bitcoins.
On the flip-side, markets have historically topped when NUPL reaches the 75% level, meaning holders on average are sitting on unrealized gains of 75% above their cost basis. We reached a peak of 66% in the current bull market back on March 4, signaling belief, but not yet the euphoria associated with prior market tops.
Mt. Gox Begins Distributing Coins
Over 10 years since an estimated 950k bitcoins were lost in a hack on the Mt. Gox exchange, creditors got their first payout of an estimated 140k bitcoins to be returned from the Mt. Gox bankruptcy estate.
50k BTC (~$3 billion) were moved last week to Kraken, and creditors have reported receiving payouts of bitcoin and bitcoin cash. More funds will reportedly be paid out via Bitstamp beginning today, July 25th.
Bitcoin was trading at about $600 at the time of bankruptcy over a decade ago. If we take 140k recovered against 950k lost and assume a ~15% recovery, we can calculate that creditors who lost bitcoin in the 2014 hack are currently sitting on a ~1,518% gain due to their forced decade long hodl, despite losing 85% of their BTC.

While the Mt. Gox distribution comes on the heels of the German government liquidating 50k BTC, it likely won’t weigh on price as much as not all of the Mt. Gox coins are likely to be sold, with NYDIG estimating about 22k BTC for sale.
Bitcoin ETF investors have been willing buyers and soaking up much of the recent supply, with the ETFs taking in BTC at a pace of 18.6k per week over the past two weeks.
Chart of the Week
Courtesy of Troy Cross on X:

In a representative survey of 3,538 Americans, the Nakamoto Project found that the political spectrum of bitcoin owners roughly mirrored that of non-owners, with owners being slightly more likely to fall into either political extreme.
Quote of the Week
“Interest Payments on US National Debt Will Shatter $1,140,000,000,000 This Year – Eating 76% of All Income Taxes Collected: Report”
— The Daily Hodl, July 21, 2024
Market Update
As of 7/24/2024:

Source: Onramp, Koyfin. 3-, 5-year figures annualized.
Bitcoin defied other assets classes this week, gaining 1.9% as everything else fell, continuing a recent divergence from stock market performance. Stocks fell as Q2 earnings reports started to roll in. Investors are looking for commentary on continued AI capex spend and for insights on when to expect resulting revenues. The tech-heavy Nasdaq 100 was hit the hardest, down 3.9% on the week and now off 8% from its highs. Small caps continued their recent surge of outperformance, but still lost 2% on the week. Gold, oil and bonds fell in sympathy with stocks as investors weigh recent weakening economic data, such as slowing retail sales and housing starts.
Podcasts of the Week
The Last Trade E059: Multi-Jurisdiction Custody with Tetra Trust CEO, Didier Lavallée
In this episode of The Last Trade, Didier Lavallée, CEO of Tetra Trust, joins to discuss transparent and fault-tolerant custody, minimizing counterparty risk, Multi-Jurisdiction Multi-Institution Custody, the partnership between Onramp and Tetra, & more.
The Last Trade E058: Bringing Bitcoin Custody Out of The Dark Ages with Alex Saleh
In this episode of The Last Trade, Alexander Saleh, Partnerships Team Lead at Coincover, joins to discuss strategic bitcoin reserve rumors, political game theory, improving custodial standards, accelerating adoption via education, & more.
Final Settlement E011: Founding Acropolis with Joe Ianni & Mason Carter
In this episode of Final Settlement, Joe Ianni & Mason Carter, co-founders of Acropolis, join the pod to discuss bitcoin treasury adoption, founding Acropolis, custody, advisory, & ancillary services, bitcoin’s settlement layer, & more.
Wake Up Call (7.22.24): Loren Asmus, Canterbury Consulting
Wake Up Call is a weekly show that will be streamed live on LinkedIn every Monday morning. To catch the premier of each episode, follow Onramp’s LinkedIn page and add Wake Up Call events to your calendar. Hosted by Mark Connors, Onramp’s Head of Global Macro Strategy, and Rich Kerr, Onramp’s President of Managed Wealth, this show seeks to provide financial professionals the “wake up call” they need, prompt them to have an open mind with respect to bitcoin, rethink their prior assumptions, become more educated on the topic, and learn from others who are already farther down this path.
Closing Note
Onramp provides bitcoin financial services built on multi-institution custody. To learn more about our products for individuals and institutions, schedule a consultation to chat with us about your situation and needs.
Find this valuable? Forward it to someone in your personal or professional network.
Until next week,
Zack Morris
