The Bondholder's Burning Platform
Jesse Myers | Chief Operating Officer
Jul 17, 2023
In management consulting, an important framework for catalyzing change in an organization is the burning platform.
At all times, there’s a great deal of inertia keeping anyone from enacting change. If you’ve been standing safely on a platform for many years, you’re not likely to want to jump off of it — but it’s a lot easier to make the leap into the unknown if suddenly the platform is on fire.
The first step in change is recognizing that you’re on a burning platform.
The status quo
When it comes to generally accepted portfolio construction, the larger the allocation to bonds, the “safer” the portfolio. When you login to Vanguard, Fidelity, or wherever your 401k lives, you’ll see portfolio composition options to choose from with descriptors like “Aggressive,” “Standard,” and “Conservative.” Standard means a portfolio comprised 60% of stocks and 40% of bonds. Aggressive means a greater % of stocks; Conservative means a greater % of bonds. The message is clear: the more bonds you have, the less risky your portfolio.
And it’s no wonder that bonds are framed in this favorable light. The quintessential bonds are US Treasury Bills (aka Treasuries, USTs, T-Bills), which is just a fancy way of saying “US National Debt coupons.” These T-Bills are widely known and universally accepted as the “risk-free asset.”
This categorization is so foundational to finance and wealth management that we never take a step back to question it. So, let’s do just that. In truth, the overall risk of T-Bills consists of three parts:
- Nominal default risk
- Verdict: Risk-free
- T-Bills are guaranteed to deliver on their nominal promises, so long as the US Government exists. If a bond promises to pay 5% of the face value of the bond every year in interest, that’s what it will do. This is because the US Government can always print more money (or issue more debt) to service its debt obligations in nominal terms.
- Duration risk
- Verdict: Try not to think about it
- Every bond has an origination date. Market conditions on that day dictate the terms of the bond, specifically the interest rate that the bond issuer promises to pay in exchange for dollars today. The problem is that interest rates change in the years between the bond’s issuance and maturity date. The result is that the market value of a bond fluctuates based on whether interest rates go up or down relative to the bond’s interest rate. If market interest rates go down, the bond’s promised interest payments are greater than what is available on newly-issued debt, so the bond trades at a premium. Vice versa if interest rates go up.
- Duration risk means that the market value of the bonds a person holds can go up or down, though the annual interest payments remain the same. As a result, duration risk is often hand-waived away by some variation of “there’s no risk so long as you hold to maturity.” In other words, you get exactly the nominal yield that you sign up for… just don’t think about it too much if interest rates go up and you’re locked in to a low-yielding bond.
- Inflation risk
- Verdict: Negligible in theory, plenty of risk in reality
- This is the hidden risk that nobody talks about with bonds.
- While T-Bills are guaranteed to pay out in nominal terms, there is no guarantee about what those future dollars will be worth in real terms. For instance, if a bond promises to pay 5% annually in interest payments, but inflation is running at 10%… congratulations, you’ve earned a risk-free nominal return while actually becoming poorer in real terms.
- The reason that nobody talks about this risk is because a bond’s interest rate is assumed to account for inflation over the life of the bond. But this overlooks a crucial scenario…
Smoke and heat
The US has a debt problem. It also has a spending problem. This is a bad combination. Over the last few decades, we have normalized massive annual deficits.
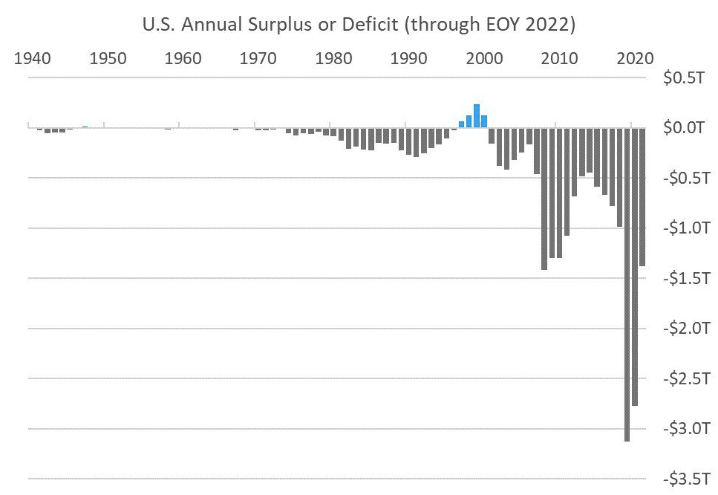
These numbers add to our National Debt, which shows the cumulative effect of these relentless deficits.
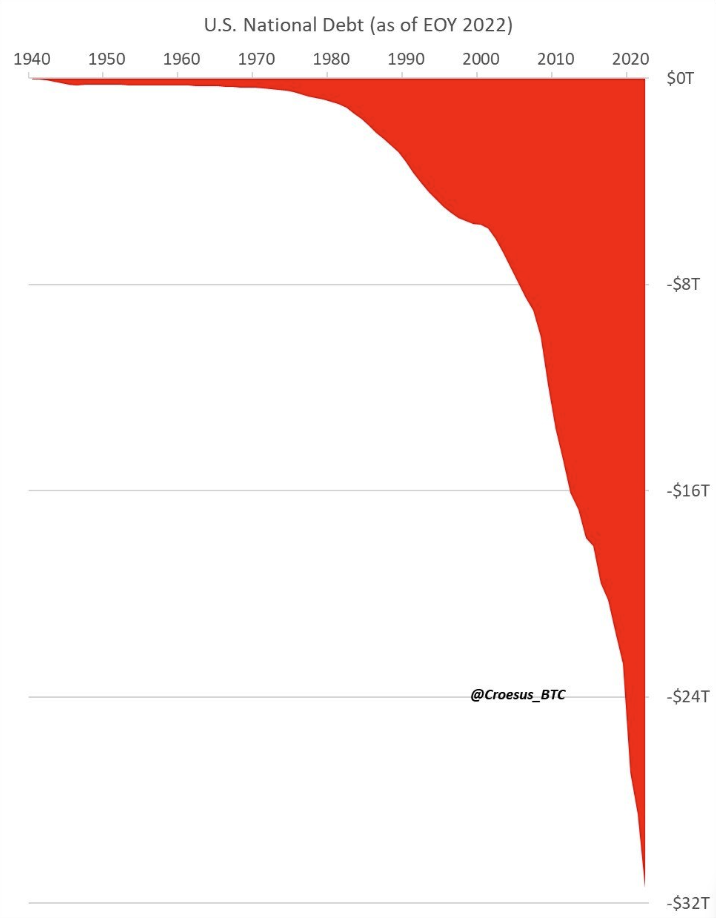
Clever skeptics are quick to point out that the above charts are fine so long as GDP growth has kept pace. Well, it hasn’t. And this is the key point, because a high debt-to-GDP ratio is the harbinger of trouble.
Since 1800, in 51 out of 52 cases where a country’s debt-to-GDP ratio reached 130%, the country eventually defaulted. The only exception is current Japan, who is frankly in the final stages of circling the drain (e.g., central bank asset purchases and yield curve control).
Where is the US now? 129% debt-to-GDP.
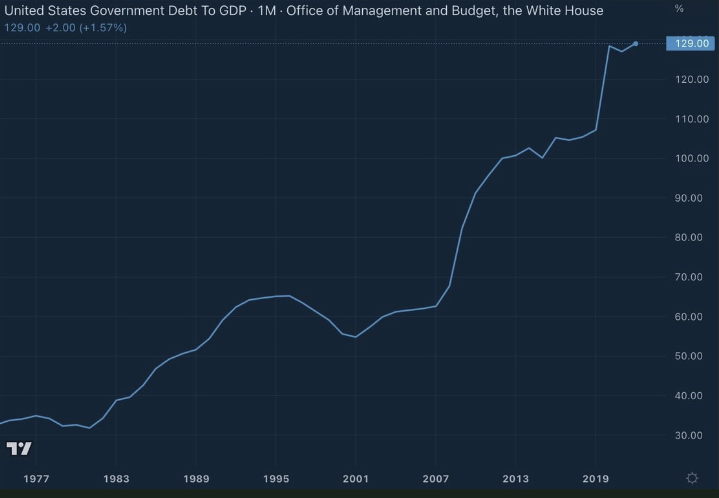
What’s more, US Gov officials fully expect this trend to continue. In fact, more alarming than that, they don’t seem to even realize that this is a five-alarm crisis. Here is an actual projection published by the U.S. Treasury Department:
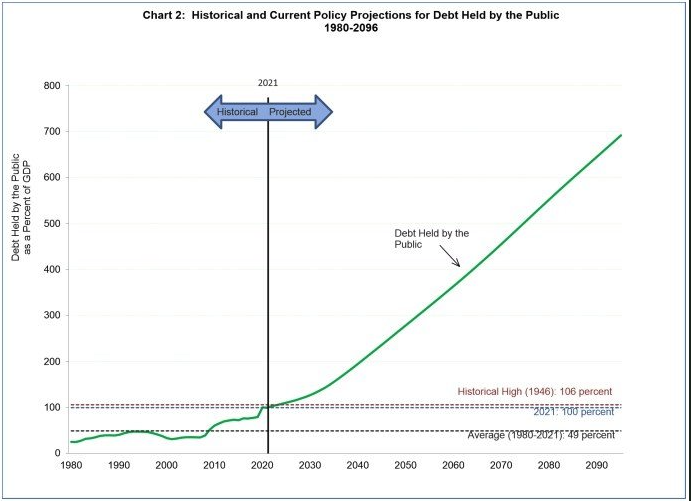
This chart looks absurd, right? Surely, things aren’t that bad?
Well, remember how politicians recently fought about raising the debt ceiling beyond $31.4T, before inevitably rubber-stamping it? The US has already added ~$1T to the US National Debt in the month since.
Remember all the fighting and drama around the 2008 bank bailouts and Occupy Wall Street? That was all because of ~$1T. We just added that in a month and nobody made a peep.
Flames are next
The only way out of the fiscal situation the US has gotten itself into is to inflate away the debt. This means letting inflation run hot for years — long enough to more-than-2x the price of everything, which makes the National Debt 2x easier to pay off (since this debt is owed in nominal terms).
There really is no other way out, it’s just math.
This inflation is an inferno that will rip through the entire global asset landscape, consuming anything in its path that it can.
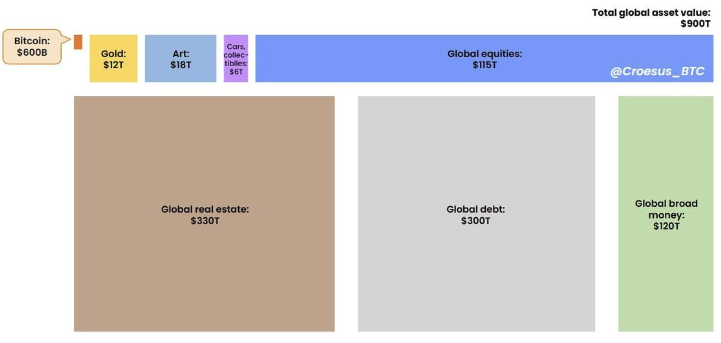
All of these asset categories shown here are their own elevated platform, each providing stability and safe-keeping for investors that choose to park value there. But they are not all made of the same stuff. Some are made of wood, others are made of various composites, and a few are made of steel.
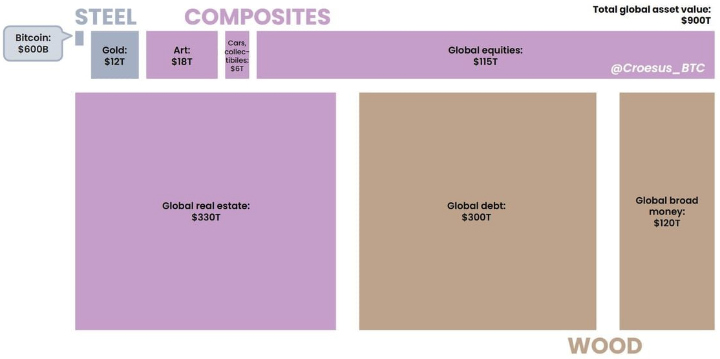
Here’s my assessment of each category’s suitability to withstand the stress of an inflationary inferno:
- Wood
- These assets are fiat currency (money) and debt contracts for future fiat currency payment streams (bonds).
- These assets will not withstand high inflation.
- Composites
- These assets carry varying properties and varying degrees of susceptibility to fire. For example, equities provide some inflation-resistance (because future cash flows will continue inflation-adjusted) but may not survive the strain of economic turmoil to get to that future state.
- Steel
- These assets are forged in scarcity and do not come with cash flows based in fiat currency terms (as equities and real estate do).
- These assets will withstand high inflation, retaining and likely growing their purchasing power (e.g., gold grew ~20x in value during the 1970s).
Taking action
Right now, there’s just smoke, heat, and a little bit of flame developing. You have time to take stock of which platforms you have stored your value on, evaluate whether any changes make sense, and take any necessary action.
The first step in this process is to figure out how much of your net worth you have in each of the asset categories above. When was the last time you logged in to your brokerage to see the composition of your 401k? What % of your net worth is currently held in bonds? My expectation is the number will surprise you.
The classic portfolio composition is 60/40/0, meaning 60% stocks, 40% bonds, and 0% hard assets (gold + Bitcoin). This portfolio made sense over the last 40 years of declining interest rates and debt-fueled financial asset valuation growth. But those conditions won’t continue — mathematically can’t continue.
Instead, the forecast is for fire. Plan accordingly.
