Bitcoin Price Indicators: Which Have Value & Why?
All models are wrong, but some are useful.
When it comes to forecasting what the Bitcoin price will do, nobody can say for certain. After 6 years following this market full-time, I’ve been right about some things and wrong about others.
The result is that over time, I’ve become more aware of what can and can’t be relied on when estimating where Bitcoin could be headed.
At this point, I only believe there’s reliable predictive power to three drivers:
Bitcoin’s halvings (and cumulative increasing scarcity over time)
Human psychology amplifying volatility in the wake of the halvings
Macroeconomic conditions (most notably, whether monetary policy is in a state of Quantitative Easing or Quantitative Tightening)
Everything else is reading tea leaves, retroactively finding spurious patterns, or downstream of the above three drivers.
Fortunately, that still gives us more reliable predictive power when it comes to Bitcoin than with traditional assets. In fact, I would argue that traditional asset valuations are primarily subject to only one driver, what was listed above as #3 (macro conditions). Increasingly, that’s the signal underneath a whole lot of noise in traditional finance – asset valuations go up when monetary policy is stimulative, and sideways or down when tightening is in effect.
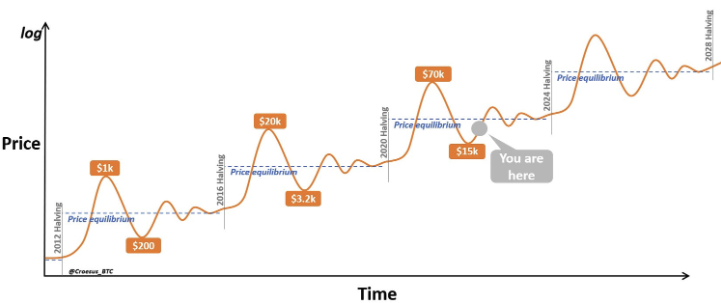
By contrast, with Bitcoin, we have Driver #1 written in stone into the Bitcoin protocol. Every 4 years, the amount of new Bitcoin issued with each block is cut in half. This mechanic of increasing scarcity delivers a quadrennial supply shock that upends the supply-demand price equilibrium, forcing the Bitcoin price to drift upwards to re-establish equilibrium. That part is guaranteed — it’s just supply and demand.
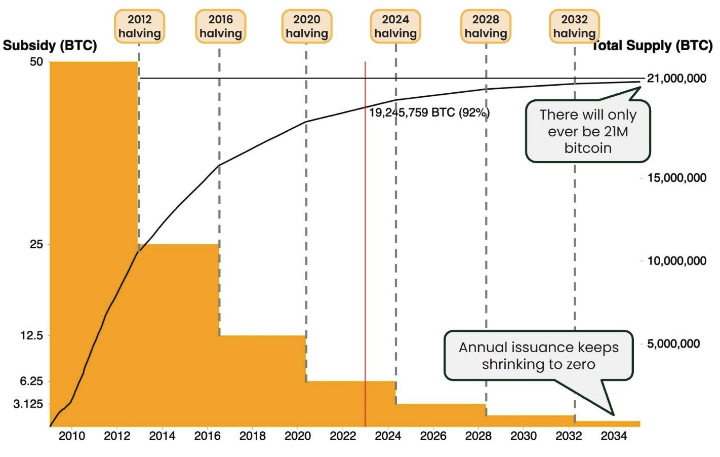
This is Bitcoin’s supply issuance schedule. I refer to it frequently, because it underpins so much about the investment case for Bitcoin.
It turns out that Driver #2 is also guaranteed — human psychology will always dogpile on a reliable upward price trend in an effort to make a quick buck. As a result, demand for Bitcoin flywheels during the post-halving bull markets, exacerbating the supply-demand disequilibrium.
This turns the organic upwards price adjustment into a bonafide bubble, causing Bitcoin’s price to shoot up higher than it “should” go. This short-term increase in demand for Bitcoin is speculative in nature, and necessarily unwinds with a nasty crash as the short-term speculators race for the exits.
It’s my personal opinion that, together, Drivers #1 and #2 create this reliable price dynamic for Bitcoin:
While I believe that the three drivers above are the only factors reliably impacting Bitcoin’s price, there are a great variety of analytical metrics in the Bitcoin market that attempt to find patterns with predictive power.
Any predictive power, in my opinion, is because these metrics are somehow quantifying the outcomes of the three drivers above — in other words, capturing the human behavior downstream of these concrete forces.
History doesn’t repeat itself, but it often rhymes. And it rhymes because humans behave in similar ways when exposed to the same set of conditions.
Because of this, I find it valuable to occasionally check in with some of the Bitcoin analytical metrics and compare them to this point in prior Bitcoin cycles (~11 months before the next halving). None of these metrics provide definitive evidence of anything, but together, they help fill in the picture of where Bitcoin is and where it is likely headed over the coming months.
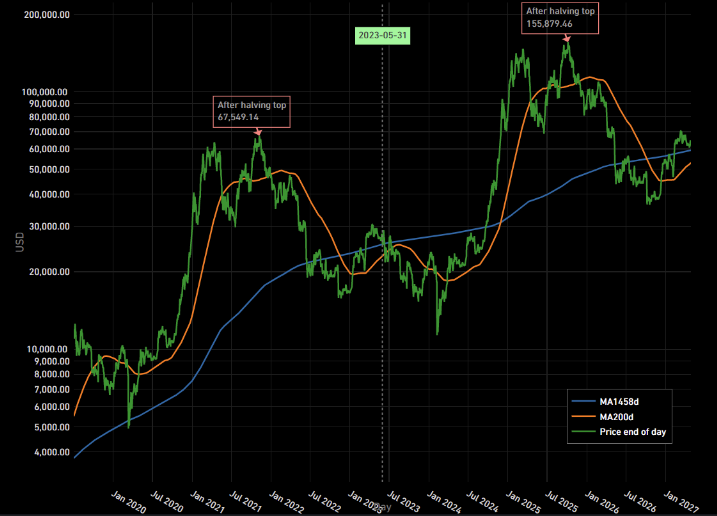
Metric: Cycle repeat
Explanation: This simple visualization repeats the last 4 years of Bitcoin price action (left side of the dotted vertical line) and projects the exact same price action for the next 4 years (right side).
Value: This metric doesn’t have any predictive power necessarily, but it is a handy reference to get a baseline understanding of:
What happened at this point in the cycle 4 years ago (the Bitcoin price went sideways for 11 months until the 2020 halving), and
What could happen to Bitcoin’s price if the 2024 halving causes the same human behavior to play out as the 2020 halving did.
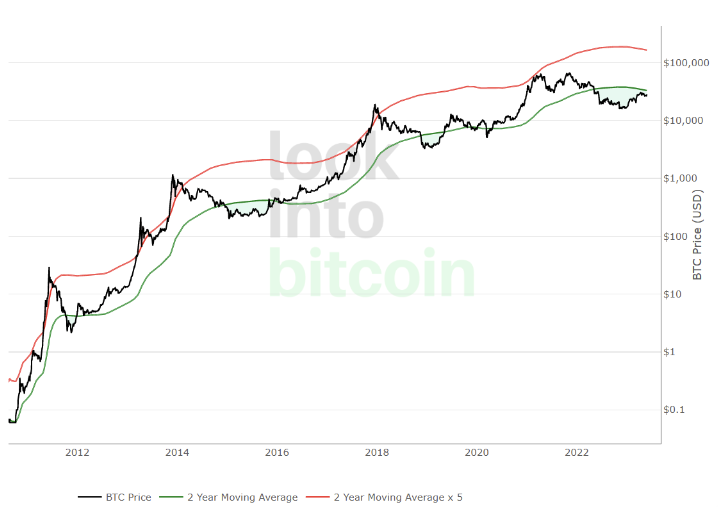
Metric: 2-Year Moving Average Multiplier
Explanation: This is a clever yet simple analytic. The green line is the “moving average” price for the prior 2 years, meaning the average price of Bitcoin for the last 730 days (calculated at every given point in time). The red line is the green line multiplied by 5.
This metric doesn’t have any predictive power, but it does an excellent job of clarifying and contextualizing human psychology when it comes to Bitcoin’s price action.
When Bitcoin’s price exceeds the red line, that means the price is running extraordinarily hot, relative to where it has been over the prior 2 years. Every major top has been characterized by crossing this red line… until 2021, when Bitcoin experienced a bi-modal, rounded top. This was driven by macro conditions interfering with and blunting the course of the bull market (China mining ban in Summer 2021 + Fed pivot from QE to QT conditions in late 2021).
On the other side of things, when Bitcoin’s price is below the 2-year moving average (as it is right now), it has always been in the depths of a major bear market. These discounts typically last for a few months before Bitcoin reclaims the 2-year moving average price and never returns.
Value: It’s my belief that this metric has a great deal of value, specifically because the 2-year moving average captures the market’s collective baseline for what Bitcoin is worth at any given point. Pure human psychology. When the price screams to 5x higher than this historical baseline, it’s reasonable to conclude that the price is overheated. And the opposite is true when Bitcoin drops below the 2-year moving average.
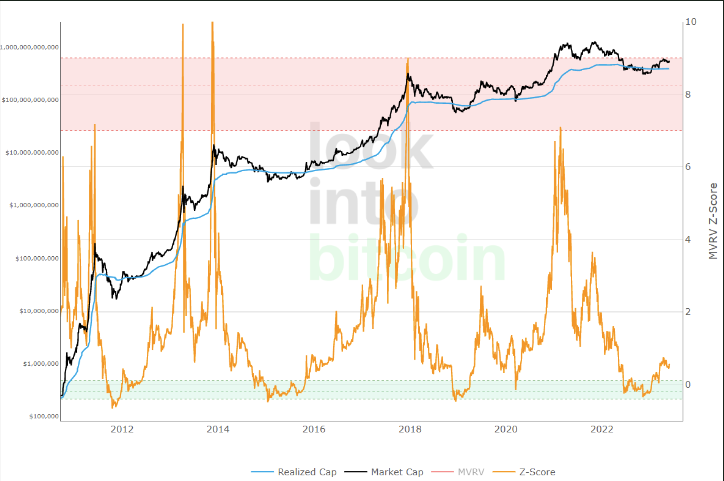
Metric: MVRV Z-Score
Explanation: This math-heavy metric shows the standard deviation between the Market Value (black line) and Realized Value (blue line). The market value is the current price of Bitcoin, whereas the realized value is the average price that every existing Bitcoin was last traded at. Finally, the orange line (Z-Score) shows how extreme the gap between the two values is, in terms of standard deviations from the historical norm. Technical stuff, but the result is a pretty clean indicator of when Bitcoin’s price is historically low or at an extreme peak (though 2021’s peak took a different shape than prior peaks).
Value: Once again, this data is helpful for highlighting when human psychology has resulted in Bitcoin’s price getting far above where it “should” be OR below where it “should” be. The recent data here suggests that Bitcoin’s excessive low has already passed.
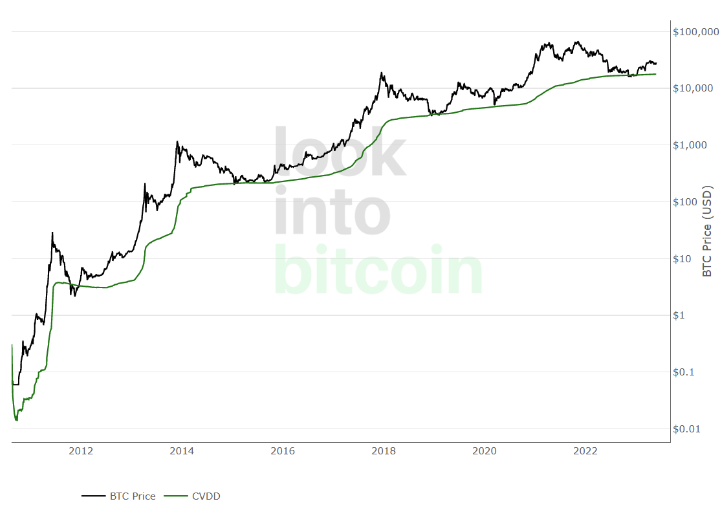
Metric: Cumulative Value Coin Days Destroyed (CVDD)
Explanation: This is the most math-heavy of the useful metrics. In short, this metric adds up the number of days that coins have been held every time they are traded. Unexpectedly, this metric lines up with all of the major historical bear market bottoms.
Value: Again, this metric has value purely because it seems to capture something about human nature. What I think it reflects is a collective unconscious valuation of what is a Bitcoin worth to the current set of holders. When CVDD jumps upward, it means that long-time holders are selling their coins to new entrants.
A byproduct of this ongoing distribution of coins to new holders is that the collective average valuation of what a Bitcoin is worth goes up. (Folks who bought Bitcoin at $1 are less inclined to back the truck up to buy more when Bitcoin drops from $70k to $15k; new entrants are more likely to scoop up these discounted coins that still feel expensive to long-time holders.)
That is my hypothesis as to why this measure seems to capture how the changing composition of Bitcoin adopters directly translates into where the price floor is at any given time. (That said, you could have a totally different interpretation!)
As with MVRV, this metric suggests that the 4-year-cycle price bottom has already passed. Bitcoin’s price recently dropped down to the green line, stayed there for a few months, and subsequently bounced. If the relationship from prior cycles remains true, Bitcoin’s price dropped to the point where the current set of adopters collectively viewed Bitcoin as a screaming deal, then bounced higher. Historically, that has meant onward and upward until the next major post-halving bull market and subsequent bear-market.
Those are the Bitcoin metrics that I think have some merit, primarily because they seem to capture various elements of human psychology to show when things are overheated or overcooled.
If you’re curious to learn more about Onramp Bitcoin, a best-in-class vehicle for HNWI and Institutions to gain exposure to bitcoin with industry-leading multi-party custody & the ability to take self-custody of your bitcoin in the future without a taxable event, check out our website here.
If you’d like to learn more about the product to see if it could be a fit for you or your network, please schedule a time to chat with us here.
And if you’ve been forwarded this email and want to receive future Bitcoin analysis like this, make sure to subscribe to our free newsletter here.
Until next week,
Jesse Myers
COO, Onramp Bitcoin
