May 5, 2026 Weekly Market Brief
Glenn Cameron, CFA · Global Head of Onramp Institutional
Free. Every week. Institutional insights, connected.
The Treasury cash-futures basis trade has grown into the single largest user of US repo financing — $6.6 trillion of borrowing against $2.5 trillion of positions, concentrated, levered, and running against a regulatory clock. What it reveals about counterparty risk is the structural case for bitcoin.
The $6.6 trillion hidden in the world's safest asset.
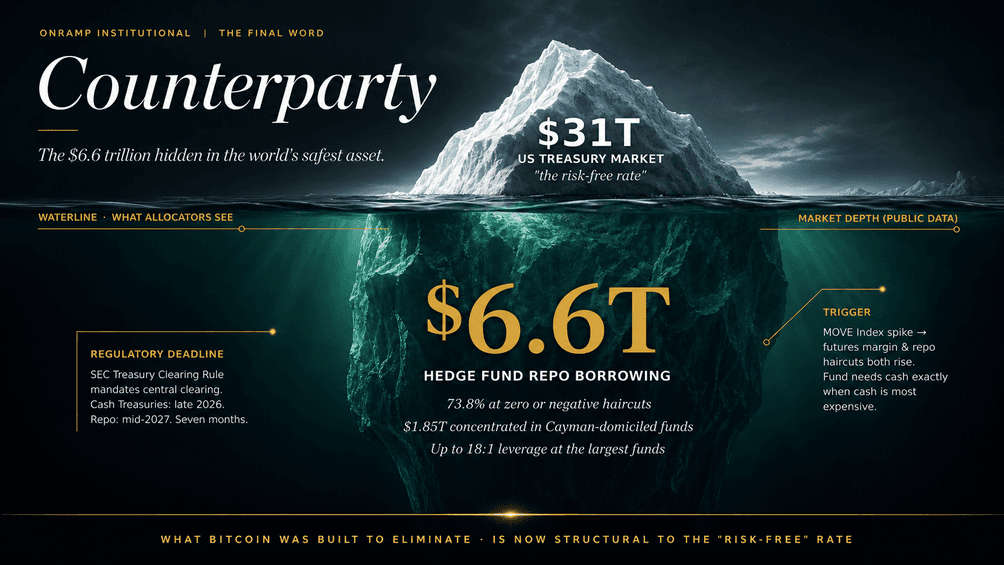
The US Treasury market is the deepest, most liquid market on earth. $31 trillion of debt outstanding. The benchmark by which every other asset's risk is measured. The collateral underneath every prime brokerage relationship, every repo book, every cross-border bank balance sheet.
This is the asset allocators are taught to think of as risk-free.
It isn't, and it hasn't been for some time. The change happened gradually, through a piece of financial plumbing that almost nobody outside fixed-income trading desks understands: the Treasury cash-futures basis trade. The trade is not new. What is new is the scale, the leverage, the concentration, and the regulatory clock now ticking against it.
Apollo's Torsten Slok flagged the problem on April 29. Federal Reserve Governor Lisa Cook flagged it the prior November. The Bank for International Settlements published a sober quarterly review in December. The Office of Financial Research has been collecting data on it since 2023. The Securities and Exchange Commission set a deadline for itself: late 2026 for cash Treasuries, mid-2027 for repo. Seven months from now the first phase of central clearing becomes mandatory. Until then, the system is what it is.
This week's brief covers what the system is, why it matters, and what it means for the case for Bitcoin.
The Trade
Strip away the jargon and the basis trade is a simple arbitrage. A hedge fund buys a US Treasury bond in the cash market. It simultaneously sells a Treasury futures contract referencing the same bond. The futures price typically trades at a small premium to the cash price because asset managers, mutual funds, and pension funds buy futures for ease of execution and balance sheet treatment. That premium is the basis. The hedge fund captures it by holding both legs to convergence.
The arithmetic looks unimpressive on paper. The basis is rarely more than 20 to 45 basis points across the curve. A pension fund earning that spread on cash would not bother getting out of bed.
So the hedge funds borrow.
They take the Treasury bond they just bought to a dealer's repo desk. They post the bond as collateral and receive cash in return. They use that cash to buy more Treasury bonds. They post those as collateral and borrow more cash. They repeat the process until they have reached their desired leverage.
JPMorgan's research desk estimates the leverage on these trades runs 15 to 20 times. Federal Reserve estimates suggest the largest funds operate at 18:1 leverage. Some independent academic estimates put the upper bound at 50:1 or higher. At 15x leverage, a 20 basis point net carry becomes a 300 basis point return on equity. At 50x, it is enough to define an entire fund's returns.
This is what they buy. Not a security. A spread. Funded with borrowed money. Repeated until the leverage hits the limit.
The Numbers
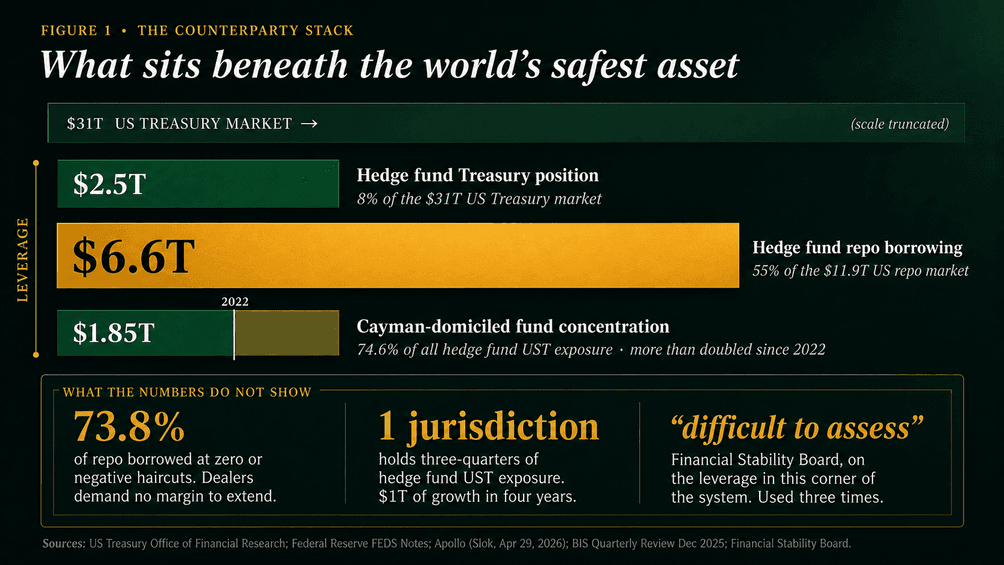
Hedge funds now own approximately 8% of the entire US Treasury market. Eight percent of $31 trillion is $2.5 trillion. They fund this position with $6.6 trillion of repo borrowing. The repo book is larger than the position because the same Treasury collateral gets pledged, re-pledged, and rehypothecated through the dealer chain.
$6.6 trillion is roughly 55% of the entire US repo market. The hedge fund basis trade is no longer a niche relative-value strategy. It is the single largest user of repo financing in the United States.
Three numbers within those numbers should make the reader stop.
First: 73.8% of the hedge fund repo book is borrowed at zero or negative haircuts. The dealers extending the leverage demand no margin to do it. They take the Treasury collateral at face value. The system functions because the collateral is considered pristine. The leverage exists because nobody has priced the collateral as risky. The two assumptions are circular.
Second: $1.85 trillion of these positions sit in funds domiciled in the Cayman Islands. That is 74.6% of all hedge fund Treasury exposure concentrated in a single offshore jurisdiction. The Cayman number is up roughly $1 trillion since 2022. It has more than doubled in four years. The growth has been entirely funded by repo.
Third: official data does not capture the full size of the position. Cayman-domiciled funds report through Form PF on a quarterly delay. Repo activity that runs through the non-centrally-cleared bilateral market is only just starting to be visible to the OFR. The Financial Stability Board's most recent assessment used the words "difficult to assess" three times in describing the leverage in this corner of the system. The funds know what they are doing. The dealers know what they are doing. The regulators are reconstructing the picture from incomplete data.
The Mechanism
Allocators trained in fixed income know the mechanism. For everyone else, here is how this fails.
The trade has two collateral requirements that move on different rails. Repo haircuts are set by dealers and rise when balance sheets are constrained or counterparty risk increases. Futures margin is set by clearing houses and rises when volatility rises. In quiet markets they sit at their floors. In stressed markets they both move at once, in the same direction, and against the fund. Repeat that. Both rise. At once. Against the fund.
The fund needs more cash to meet futures margin calls. It needs more collateral to maintain repo positions at higher haircuts. The cheapest source of cash is selling Treasury bonds. The fund sells. So does every other fund in the same trade, because they all triggered the same margin calls on the same morning. The selling pressure widens the basis spread. The widening basis makes the trade look worse, which prompts risk managers to reduce exposure further. The reduction forces more selling. The cycle compounds inside a single trading session.
This is not theoretical. It happened in March 2020 when COVID shut the global economy.
Hedge funds running the basis trade sold roughly $200 billion of Treasuries in a few days. The basis widened from 20 basis points to over 70 basis points. Bid-ask spreads on off-the-run Treasuries widened tenfold. Repo rates spiked intraday by 150 basis points. The Fed intervened with a trillion-dollar bond-buying programme, and that was just the first leg. By the end of 2020 the balance sheet had grown by $3.2 trillion.
It happened again, smaller, in April 2025 during the Trump tariff volatility. The MOVE index spiked above 30. Basis funds shed roughly 10% of gross notional in three sessions. Margin calls cleared. Daily term-repo auctions held. The Fed did not have to formally intervene. But it was a near miss.
Apollo's Slok used the phrase "shockwaves through global fixed-income markets" to describe what an unwind would look like at current scale. Run the arithmetic. If repo haircuts rise from zero to just 2% across the $1.85 trillion Cayman-domiciled position, immediate margin calls total $37 billion. At 15x leverage, that requires the funds to deleverage by roughly $555 billion in Treasury sales. Two and three-quarter times the March 2020 unwind, in a market that has not become more liquid since then.
The Concentration
The problem the SEC, the Fed, and the FSB are all trying to solve is concentration.
In 2007 the failure of two Bear Stearns hedge funds spooked credit markets but did not break them. Why? Because the broader system was diversified. Subprime mortgages were owned by hundreds of different firms running hundreds of different strategies. The Bear funds were a leading indicator, not the entire market.
The basis trade is different. The top fifty Treasury-focused hedge funds, out of roughly 2,069 qualifying funds, hold 85% of total hedge fund Treasury exposures. The same fifty firms run the same trade through the same dealers using the same repo desks against the same cheapest-to-deliver bonds. When stress hits, they do not diversify each other. They amplify each other.
BIS researchers tracked this in their December 2025 quarterly review. Alongside the basis trade, hedge funds have been growing a related strategy called the swap trade, which combines long Treasury cash positions with pay-fixed interest rate swap positions. The swap trade has roughly doubled in size since early 2024 to over $630 billion notional. It uses the same repo financing as the basis trade. It is held by overlapping participants. The two strategies are not independent; they are two faces of the same leverage.
Concentration of strategy. Concentration of jurisdiction (Cayman). Concentration of counterparty (the same handful of dealers). Concentration of collateral (a small number of cheapest-to-deliver bonds).
When the system has this many overlapping concentrations, what looks like depth from the outside is choreography on the inside. Everyone is doing the same thing. When they all turn around at once, the door is the same width as it was before, but the queue is longer.
The Deadline
Regulators have known about this since March 2020. The SEC's response is the Treasury Clearing Rule, finalised in December 2023 with phased implementation.
Cash Treasury trades must clear through a central counterparty starting late 2026. Treasury repo must clear through a CCP starting mid-2027. Once central clearing is mandatory, the dealers no longer extend bilateral leverage at zero haircut. The CCP demands margin calculated by a transparent risk model. Leverage compresses. The basis spread widens because the trade becomes less profitable. The trade gets smaller, possibly much smaller, possibly fast.
Two things matter about this deadline.
The first is that it is happening. The system has a known terminal date. After mid-2027 the basis trade as currently structured cannot exist at current scale. That is not speculation; it is regulatory text already on the books.
The second is the gap between now and then. Seven months until cash trades centrally clear. Fourteen months until repo follows. In that window, every existing position has to either run off naturally, unwind into the market, or be migrated to cleared infrastructure that does not yet exist at the required throughput. The DTCC's Fixed Income Clearing Corporation is building capacity. It is not finished. Dealers are testing. Funds are preparing. The migration window is narrower than most participants are comfortable acknowledging in writing.
If volatility rises during the migration window, the funds running the basis trade will not have the option to ride out the storm. They will unwind into a system that is both stressed and changing its plumbing. The Fed will face the same choice it faced in March 2020 and April 2025: intervene with balance sheet expansion or watch the world's deepest market dislocate. The historical record is clear on which one it picks.
Where Bitcoin Fits
This is not a piece predicting an unwind on a specific date. The trade may run for years. Central clearing may transition smoothly. Volatility may stay low. The Fed may execute a surgical intervention that contains the spillovers without expanding the balance sheet meaningfully.
The insight sits one level deeper than the prediction.
Every portfolio has to answer two questions. Who pays you, and what are they paying you in. The first is about solvency. Will the entity at the other end of the trade actually deliver the cash flow they promised? The second is about purchasing power. When the cash flow arrives, will it buy what the cash flow was supposed to buy?
For most of the post-war period, allocators have answered both questions with the same instrument. Treasuries pay reliably. Dollars hold value reliably enough. One asset, two answers. The arrangement was so durable that the second question stopped being asked.
That arrangement is breaking apart in front of us. The Treasury market still answers the first question. An entity that issues debt in a currency it can print cannot involuntarily default in nominal terms. But the mechanism by which it avoids defaulting now requires intervention at scale that materially debases the unit the debt is denominated in. The first question gets answered every time. The second question gets a worse answer every time the first answer is enforced.
This is what the basis trade plumbing reveals. The Fed's reaction function is the answer to the first question. M2 expansion is the cost of that answer. The two are now visibly linked through a regulatory clock with the date of the next intervention printed on it.
The Satoshi whitepaper is, among other things, an argument about counterparty. The first paragraph names the problem: a financial system based on trust requires institutions whose failure damages the system. Bitcoin's design substitutes mathematics for trust at the layer where trust matters most. The properties everyone repeats: bearer asset, no counterparty, fixed supply, censorship-resistant, verifiable, final settlement. Each one is an answer to a specific failure mode of the legacy system.
For two decades, allocators have been able to dismiss those properties as solving problems they did not have. Treasuries cleared. Repo functioned. Custody worked. The plumbing was invisible because it worked.
The plumbing is no longer invisible. Apollo's chief economist warned about it last week. The Fed's own governor warned about it in November. The BIS warned about it in December. The OFR has been warning about it since 2023. A regulatory deadline now exists because regulators have decided, on the record, that the current configuration is not safe to leave alone.
Bitcoin is the second answer to the second question. Treasuries still answer the first. The portfolio that holds both has answered both questions. The portfolio that holds only Treasuries is short the second answer at exactly the moment the first answer requires the second answer to be paid. That is not a diversification argument. It is a structural one.
The Radar
What matters this week across digital assets, AI, and global markets.
Digital Assets & Regulation
ETFs: the streak that ended hard
From April 14 through April 24, US spot Bitcoin ETFs added $2.1 billion across nine consecutive trading sessions. It was the longest and largest inflow streak since October 2025. Then April 27 through April 29 reversed it: $490 million in net outflows across three sessions, the worst three-day stretch since late January. May 1 bounced back with $731 million in single-day inflows. Despite the volatility, April closed with $1.97 billion in net inflows across the twelve funds. That is the strongest month since October 2025 and roughly 50% above March's $1.32 billion. BlackRock's IBIT now holds approximately 812,000 BTC, $62 billion in AUM, and 60% of the spot ETF market by share.
Bitcoin spent the month between $74,973 and $79,400, briefly tagging $80,000 on April 14 before rejecting. The price has not closed above $80K since the February 5 crash to $60,000.
The institutional read is consistent. Allocators are buying the asset class. They are not yet buying it with conviction at the top of the range. Every approach to $80K is being faded. Every drawdown to $74K is being absorbed. The range will resolve. The flows say the resolution is more likely upward than downward.
CLARITY: the compromise text
On Friday May 1, Senators Tillis and Alsobrooks released the final stablecoin yield language for the Digital Asset Market Clarity Act. The compromise prohibits passive yield on stablecoin balances economically equivalent to bank deposit interest, while permitting activity-based rewards tied to payments, transfers, and platform use.
Coinbase CEO Brian Armstrong's response on X was two words: "Mark it up." Polymarket odds for 2026 passage moved from 46% to 55% over the weekend. More than 100 industry trade groups have backed the bill. Senate Banking Committee Chairman Tim Scott is reportedly pushing for a presidential signature by summer 2026, and is working to lock all 13 Republican members of his committee for the markup vote.
Five steps remain: Senate Banking markup; full Senate floor vote requiring 60 votes; reconciliation with the Agriculture Committee version; reconciliation with the House-passed July 2025 version; and presidential signature. Ripple's Brad Garlinghouse projects passage before the May 21 Memorial Day recess. Senator Lummis last week at Bitcoin 2026 Las Vegas: if Congress misses this window, the timeline pushes to 2030.
What survives this process becomes binding federal law. The SEC/CFTC jurisdictional line stops being reversible by executive order. That is the difference between institutional capital being able to underwrite twenty-year product roadmaps around digital assets, and having to assume that all current guidance could be rolled back after the November midterms.
Strategy: earnings tonight, $14.5B in the hole
Strategy reports Q1 2026 earnings after market close at 5pm ET tonight. The setup is unlike any prior earnings call in the company's history.
Saylor confirmed on Sunday that no Bitcoin was purchased this week. It is the first explicit pause of 2026 and breaks a near-weekly accumulation cadence. Strategy now holds 818,334 BTC at an average cost of $75,532. Q1 saw aggressive accumulation: 89,600 BTC added for $5.5 billion, the second-largest quarterly purchase in company history. Bitcoin fell more than 20% across the same quarter, generating a $14.5 billion unrealized GAAP loss now disclosed in the Q1 filing.
STRC, the perpetual preferred share Strategy launched as its primary funding engine, has traded below par this week. The instrument pays an 11.5% monthly dividend and is engineered to trade at $100 per share. Critics including Peter Schiff and Seeking Alpha analyst Joseph Parrish have flagged that current cash reserves cover roughly two years of dividend obligations at the current STRC outstanding balance.
What allocators are watching tonight: the dividend frequency vote, any guidance on the STRC issuance pause or restart, the company's view on its current $1.23 billion annual preferred dividend obligation against $477 million in software revenue, and Saylor's own framing of the buy pause.
AI & Financial Infrastructure
$650 billion of intent, capacity-constrained
Big Tech Q1 earnings reported April 29 and 30 confirmed what the Sightline data flagged on April 19. Combined 2026 capex from Meta, Microsoft, Alphabet, and Amazon now sits between $650 and $700 billion. Every one of them raised guidance from prior quarters.
Meta lifted its 2026 range from $115-135 billion to $125-145 billion. Its stock fell 6% after-hours on the announcement. Microsoft raised its full-year capex to $190 billion, up $25 billion from prior guidance, attributing the increase explicitly to component pricing. Alphabet raised to $180-190 billion and signalled that 2027 will be "significantly higher." Amazon held at $200 billion.
The line that matters: "capacity-constrained through 2026." Microsoft CFO Amy Hood used the phrase three times on the call. Microsoft's commercial cloud bookings backlog is now $627 billion, up 99% year-over-year. The company has $627 billion of orders it has booked and cannot fulfil. Azure revenue grew 40% YoY. The AI business hit a $37 billion annualised run rate, up 123% YoY. Capacity is not the demand constraint. Capacity is the supply constraint.
This is the Bottleneck thesis from an earlier Onramp Weekly Brief printed in Q1 financials. The capital is in the door. The infrastructure is not built. The market punished spending despite the revenue confirmation because the supply chain has become the binding variable.
Memory sold out, custom silicon goes mainstream
Beneath the capex headlines is a new constraint that did not exist twelve months ago: high-bandwidth memory is sold out through 2026.
HBM is the specialised stacked DRAM that GPUs require to feed compute units fast enough to avoid bottlenecking. Samsung, SK Hynix, and Micron are the three suppliers. All three are reportedly fully booked through year-end 2026. Component prices are rising. Microsoft and Meta have both attributed portions of their capex increases to memory pricing rather than capacity additions.
The hyperscaler response is to bypass Nvidia. Meta's MTIA, Google's TPU v6, and AWS Trainium 2 are all scaling to production volumes in 2026 that put each hyperscaler within reach of internal silicon supplying a meaningful share of their inference workloads. The chips are not faster than Nvidia's. They are available, owned, and not subject to allocation queues that depend on a single vendor's manufacturing partner. Allocators tracking the AI capex cycle should pay attention to the supply chain disintermediation. The companies that have been the structural beneficiaries (Nvidia, TSMC, the HBM trio) face a buyer base that is actively reducing dependence on them. The trade is not over. Its character is changing.
Powell's last meeting; Warsh on track
On April 30, Jerome Powell chaired his final FOMC meeting as Federal Reserve Chair. The committee held the Federal Funds Rate at 3.50 to 3.75% for the third consecutive meeting. CPI sits at 3.3% with energy prices climbing. The Fed is paralysed by the same trade-off it has faced all quarter: cut into rising inflation expectations, or hold and watch the credit cycle deteriorate. Powell's term expires May 15.
Kevin Warsh cleared the Senate Banking Committee 13-11 on April 29 in a strict party-line vote. The full Senate vote is scheduled for the week of May 11. If confirmed by May 14, Warsh becomes Chair without interregnum.
Why this matters for AI infrastructure: Warsh has publicly described the 2022-2023 inflation episode as "the Fed's biggest policy mistake in four decades" and has consistently advocated for rate policy to support productive investment cycles. JPMorgan's research desk expects Warsh to cut faster than Powell would have, and to be more tolerant of headline inflation while structural shifts work through the economy. If correct, the cost of capital for the $650 billion 2026 capex programme falls. Hyperscaler returns on that capex improve. The AI infrastructure cycle gets a monetary tailwind exactly as the supply chain becomes the binding constraint.
Geopolitics & Markets
Iran attacks the UAE
On Monday May 4, Iran's Revolutionary Guard Corps launched 12 ballistic missiles, three cruise missiles, and four drones at targets in the United Arab Emirates. UAE air defence intercepted the majority of incoming munitions. Three civilians were injured. A drone attack penetrated UAE airspace and ignited a fire at the Fujairah oil hub, the country's primary export terminal. It is the first major regional energy infrastructure strike of the war.
Concurrent with the UAE attack, Iranian forces engaged US naval and commercial vessels in the Strait of Hormuz. US Central Command confirmed it sank six Iranian small boats. Iran's Fars news agency claimed an American frigate near the Gulf of Oman had been struck and forced to retreat; the US Navy denied the report. Two American-flagged commercial vessels successfully transited the Strait under US escort, the first such passage since the blockade began on April 13.
Trump on Fox News Monday evening: Iran would be "blown off the face of the earth" if it targeted US assets. He separately suggested the conflict could continue "another two to three weeks." Iran's response on Tuesday was a 14-point peace proposal calling for resolution within 30 days, contingent on the lifting of the US naval blockade. Trump told reporters he was reviewing the proposal but expressed scepticism.
The ceasefire that held since April 7 is now functionally broken. What replaces it has not been negotiated. What sits in its place is daily exchange of fire and a 14.5 million barrel-per-day production shortfall.
Brent at four-year high; regional scarcity flagged
Brent crude closed at $114.44 per barrel on Monday May 4, up 6% on the day and the highest settlement since May 2022. WTI advanced 4% to $106.42. The intraday peak on May 1 was $116.10. Brent is now up more than 50% since the war began on February 28.
Goldman Sachs published a research note Monday warning of regional product scarcity. Total global oil stocks, including crude and refined products held both on land and at sea, sit at approximately 101 days of demand. Goldman estimates this falls to 98 days by end of May. Aggregate global inventories remain above emergency thresholds. The aggregate masks the regional picture.
Goldman flagged South Africa, India, Thailand, and Taiwan as facing the highest near-term risk of refined product shortages. These are not the headline economies that dominate Western financial coverage. They are major manufacturing and shipping hubs. Disruption in any of them feeds directly into supply chain pricing for goods imported into the US and Europe. The next leg of the inflation impulse may not come from the Strait itself. It may come from the second-order effects on countries that depend on the Strait and have been quietly running their inventories down.
The EIA's latest forecast: Brent peaks at $115 per barrel in Q2 2026 in its base case, with shut-in production reaching 9.1 million barrels per day in April. The base case assumes resumption of regional production in late 2026. The base case has been revised three times since February.
The cartel that competes with itself
Inside the broader story sits a smaller one that captures the structural reshaping underway. Iraq, a founding OPEC member, is reportedly offering its term buyers steep discounts for crude loaded this month, on the condition that buyers are willing to accept tankers transiting the Strait of Hormuz. Bloomberg first reported the discounts on Monday. CNBC has contacted Iraq's oil ministry. No response has yet been received.
This is what cartel discipline looks like when the cartel members are competing for the diminishing pool of buyers willing to take the transit risk. Saudi Arabia, Kuwait, the UAE, and Qatar all run their export operations through the same waterway. Iraq is undercutting them on price to capture the share that remains. The OPEC+ symbolic June production increase agreed last week, formally a 137,000 barrel-per-day adjustment, is largely meaningless inside this dynamic. The marginal price-setter is no longer the cartel. It is the willingness of individual buyers to accept transit risk.
The Week in Numbers
| Indicator | Reading |
|---|---|
| Brent crude (4-yr high) | $114.44 |
| Bitcoin price (post-extension high) | ~$78K |
| April BTC ETF inflows | $1.97B |
| Strategy Q1 unrealized loss | $14.5B |
| Big Tech 2026 capex | $650B+ |
| Microsoft cloud backlog | $627B |
| Iranian munitions at UAE | 19 |
| Polymarket: CLARITY 2026 | 55% |
What to Watch This Week
| Date | Event | Why it matters |
|---|---|---|
| May 5 (Tue) | Strategy Q1 earnings | 5pm ET. STRC dividend frequency vote, buy-pause guidance, $14.5B loss reconciliation. |
| May 6 (Wed) | Saylor at Consensus Miami | First public commentary post-earnings. Watch for STRC issuance language. |
| Wk of May 11 | CLARITY Senate Banking markup | If no markup before May 21 recess, 2026 passage odds collapse to single digits. |
| Wk of May 11 | Warsh full Senate confirmation vote | If confirmed, becomes Chair before Powell exit. Rate trajectory shifts. |
| May 15 (Fri) | Powell term expires | End of an era. First Fed Chair transition into a tightening cycle since 1979. |
| May 21 (Thu) | Memorial Day recess deadline | Last working day before two-week recess. Effective deadline for CLARITY committee action. |