September 12, 2024 Roundup: Stagflation Fears, Rising Defaults, & Consumer Pain

Mark Connors | Managing Director, Head of Global Macro Strategy
Free. Every week. One story that matters, read all the way down.
Economics, Markets, & Players
Economics
- Wednesday’s U.S. CPI prints higher than expected on elevated shelter and food prices, raising the specter of stagflation as hiring declines. Shelter accounts for over 1/3rd of CPI inputs and tends to be sticky.
- Consumer Credit’s 6% monthly increase is worrisome as credit card defaults increase to 3.25% (Q2 2024 data), the highest level since Q4 2011, when banks were recovering from the aftermath of the 2008 global financial crisis.
- Bitcoin Miner revenue continues its post-halving decline, falling back to its September 2023 levels when BTC was just $26k. We see this as a cyclical dynamic, and NOT the existential moment facing Europe discussed in our players section.
Markets
- The YTD Market leaders, NASDAQ (+15.6%) and bitcoin (+26%), remain rangebound, while Gold (+22%) rests below its $2,530 ATH set last month.
- WTI Crude (-2% YTD) plumbed new lows, hitting $65/barrel, its lowest since November 2021, and acted as a major dampening force in Wednesday’s CPI.
- Bitcoin dominance (56.1%) sits just below its cycle high with potential to lift later this year. Where the political logjam in crypto policy needs to be resolved for altcoins to enjoy any potential lift, we believe bitcoin’s price prospects are simpler, with the likely post-election fiscal pump being the next catalyst.
Players
- The Fed is in a pickle, with sagging employment and Crude prices hinting at recession, but persistent inflation hamstrings their commitment to a ‘soft landing’…if a recession presents.
- The Dubai Financial Authority (DFA) approved Standard Chartered’s request to custody Bitcoin and Ethereum. Digital asset pioneer Brevan Howard will provide services in support of the effort.
- Banks get a break from the Fed who cut their planned increases for bank capital by more than half, excluding banks between $100B and $250B from the requirement. As credit card defaults rise, maybe the Fed is aware that an 18% increase in capital was unrealistic as banks write down consumer losses.
- Monday, the EU released The future of European competitiveness, effectively stating that Europe better start changing its bureaucratic ways and embrace technological innovation, or it won’t be pretty.
Looming Fed Activism
With the U.S. Presidential election less than 60 days away, there is a 99% chance that the Federal Reserve Open Market Committee (FOMC) will cut rates for the first time in over 3 years, per Polymarket.
We expect MORE rate (MOVE Index) and currency (JPYUSD) volatility to negatively impact risk assets in the coming weeks. However, we expect ANY material market volatility to be met with action by central banks, similar to the Bank of Japan’s resumed buying of JGBs after last month’s 9.7% swoon in the NKY 225.
Pulling back the lens a bit for color on the medium to longer term direction of the economy and market, we offer the below graphs.
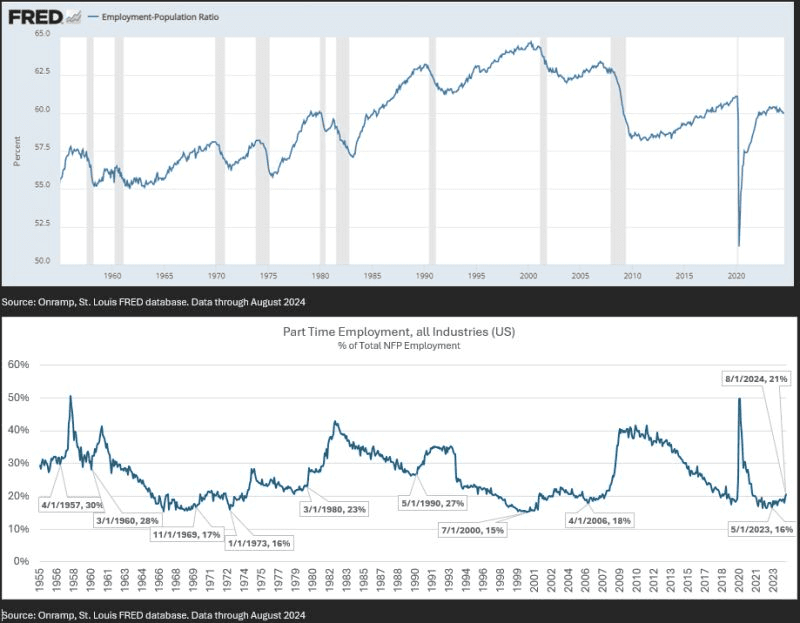
The top graph lifted directly from the St. Louis Federal Reserve site provides us two insights, speaking to productivity gains, shifting demographics and a widening wealth gap.
First, the frequency of recessions has decreased, as have their duration (number of months/quarters). We see this as a combination of productivity gains by U.S. corporations and increased intervention by a more activist Fed and Treasury.
Second, the U.S. is employing LESS of its population, peaking in April 2000. Where the increased participation of woman in the workforce swelled the ranks working population starting in the 1970s, a number of factors have pushed it lower since 2000, including fewer workers entering (declining birth rates) and more of the 55+ population exiting at a faster rate. This last trend is due in part to the degradation of buying power from ‘the living wage’. As we wrote in last week’s Roundup, wages have NOT kept up with housing or education. This may have enticed the 55+ crowd to ‘sit on their assets’ instead of working for incremental, but less potent wages.
The second graph above suggests that the employment market is bracing for a recession if history holds. Given the combination of employers backfilling part-time workers after over firing and workers filling income gaps with multiple part-time roles…the relationship between recession and rising part-time employment is pretty clear.
We do know that MANY factors have changed over time, but the combination of these two graphs suggests to us that Fed activism will likely reassert in a market that is highly leveraged at the federal and consumer level, and accustomed to bailouts.
If we are wrong, and the Fed allows a full default cycle like 2002, well, then Warren Buffet’s 20% cash position may be the signal…along with Bitcoin.
Gimme Shelter
The U.S. consumer is running for cover and paying dearly for it.
Monday’s consumer credit release indicates behavior changed dramatically as borrowings, led by the revolving lines, posted the highest rate in over 2 years of $25.3 billion. The 6% increase was over 2x the estimated $12.3B, bringing total consumer debt to $5.1 trillion.
Turning the screw of unaffordability tighter was Wednesday’s higher than expected CPI print, led by shelter. Where CPI is based on August data, consumer credit is July data, suggesting the consumer will keep running for credit as jobs decrease and cost of food, rent increase.
But it is worse for those in Europe.
Monday’s report on the EU’s lack of competitiveness on the world’s stage that we highlighted above informs outcomes across Economics, Markets and Players within, the consumer in particular.
Penned by Former Italian Prime Minister and ECB head, the full 328 page report, is best summed up by the below statement which is applicable to the U.S. consumer whose buying power is being sapped, left with few options other than the unsustainable choice of more credit card debt.
“If Europe cannot become more productive, we will be forced to choose. We will not be able to become, at once, a leader in new technologies, a beacon of climate responsibility and an independent player on the world stage. We will not be able to finance our social model. We will have to scale back some, if not all, of our ambitions. This is an existential challenge”
The below excerpt highlighting the degree to which Europe lags the U.S. in venture capital investment should also act as a shot across the bow for the next U.S. President that further innovation is needed to maintain our leadership in technology, as others are coming. Without the U.S. investment in the internet, we would not have stock market gains of ~10-12% a year…food for policy thought when the next president eyes a Bitcoin policy.
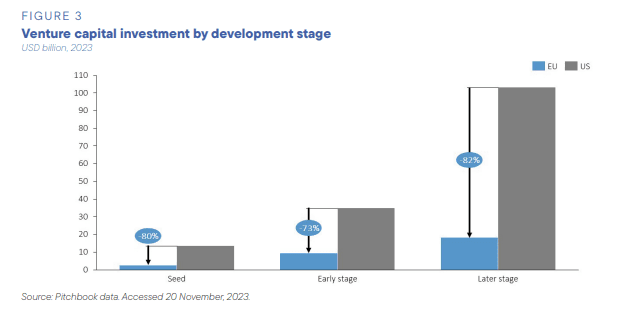
The call to embrace productivity is all the more urgent given the decline in the percent of employed persons in the U.S. Part demographics, part growing reliance on rising asset prices, it is clear that those that embraced technology and/or owned assets are better off.
Chart of the Week
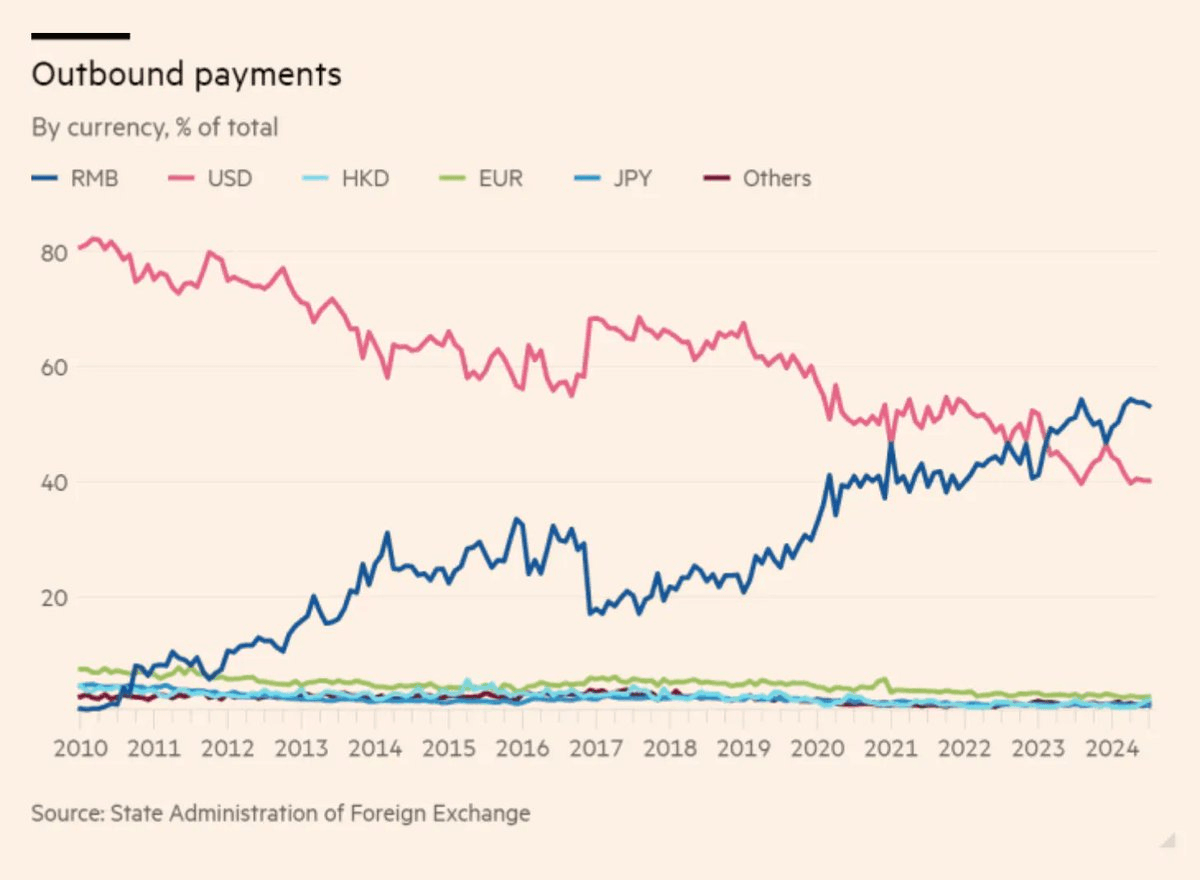
“15 years ago, China paid for almost everything in dollars.
Today is a very different story”
Quote of the Week
“Competitive edges in investing are few, and they tend to erode due to rapid exploitation. However, there is an exception to this: a long-term investing approach in a short-term world. This is referred to as time arbitrage.
Time arbitrage only works if there is an imbalance between short-term and long-term investors. If all investors were long-term, it would not lead to above average results.
However, if the proportion of investors shifts in favor of short-term investors, then time arbitrage becomes a viable strategy.”
— Aamer Khan, Co-founder of Qualivian Investment Partners
Podcasts of the Week
The Last Trade E064: Future-Proofing Multi-Asset Portfolios with Jeroen Blokland
In this episode of The Last Trade, Jeroen Blokland, Founder of the Blokland Smart Multi-Asset Fund, joins to discuss portfolio construction, the importance of scarce assets, asset allocation disruption, the role of volatility, counterparty risk, & more.
The New Frontier E004: Bitcoin and Islam with Bitcoin Majlis
In their latest episode, hosts Harris Irfan & Ralph Gerban are joined by Abdullah and Salah from Bitcoin Majlis, a platform aimed at educating the Muslim community about Bitcoin through a sound money perspective.
Wake Up Call (9.9.24): Wyatt O’Rourke, Founder of Basilic Financial
In this episode of Wake Up Call, hosts Rich Kerr & Mark Connors are joined by Wyatt O’Rourke, Founder of Basilic Financial to discuss bitcoin’s core properties that set it apart from the rest of the global asset landscape.
Closing Note
Onramp provides bitcoin financial services built on multi-institution custody. To learn more about our products for individuals and institutions, schedule a consultation to chat with us about your situation and needs.
Find this valuable? Forward it to someone in your personal or professional network.
Until next week,
Mark Connors & Brian Cubellis