September 14, 2023 Roundup: Revisiting Dollar Depreciation

Dylan LeClair | Guest Contributor
Free. Every week. One story that matters, read all the way down.
Hi all,
This is Dylan LeClair, presenting this week’s Onramp Weekly Roundup.
Before we get started… If you’re a HNWI or Institution looking for the best way to get exposure to bitcoin, Onramp Bitcoin could be the right fit for you – schedule a chat with us to discuss your situation & needs.
And now, here’s the weekly roundup…
Revisiting Dollar Depreciation: A Comprehensive Analysis
In this week’s issue, we are going to revisit a concept that is often discussed in finance circles, but with a slight twist of nuance. Readers can visit Twitter/X themselves for a more active debate on the topic at hand.
Unveiling the Nuances in Traditional Depreciation Charts
It’s common to encounter graphical depictions showcasing the decline of the United States Dollar (USD) over time, usually normalized to $1.00. While such visuals offer compelling narratives, they often overlook the critical component of short-term yields.
Before diving into the data, let’s note some nuances. When adjusting for inflation against short-term interest rates, it’s crucial to account for capital gains taxes; sadly, for the American public, inflation is not tax-deductible. Secondly, the changing methods of inflation calculation over time make historical comparisons tricky. These are all points we figured were worth addressing before diving into the meat of our analysis.
A New Lens: Purchasing Power Adjusted for Yields and Inflation
We’re taking a different look at how far $1 goes when you account for yearly inflation based on the Consumer Price Index (CPI), compared to what that dollar is worth when you also consider 1-year Treasury yields. Starting from 1962, the difference is huge: the value of $1 jumps to $1.85 when you factor in Treasury yields and inflation, but shrinks to just 10 cents when you only adjust for inflation. So what is valid?
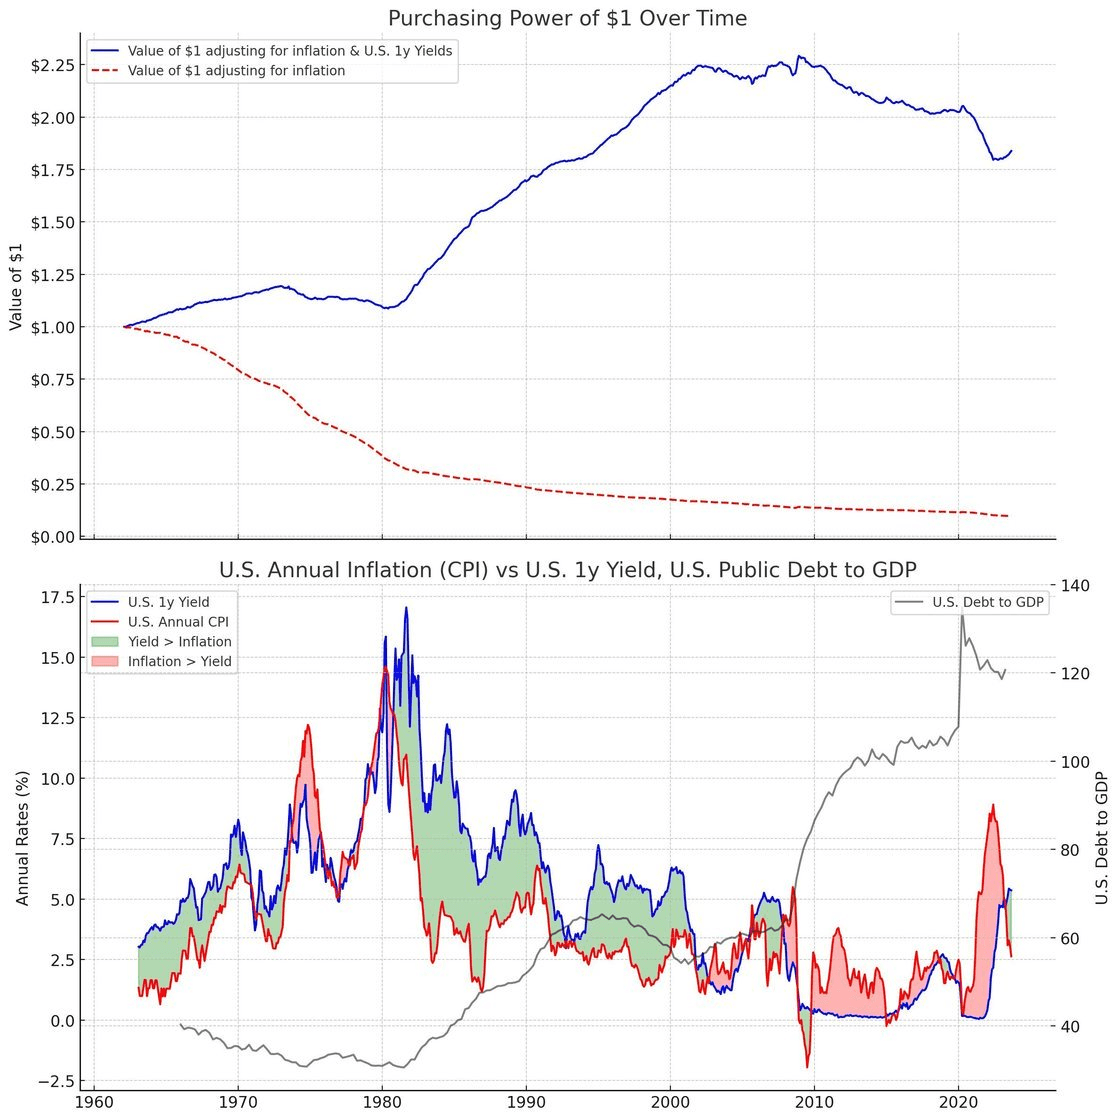
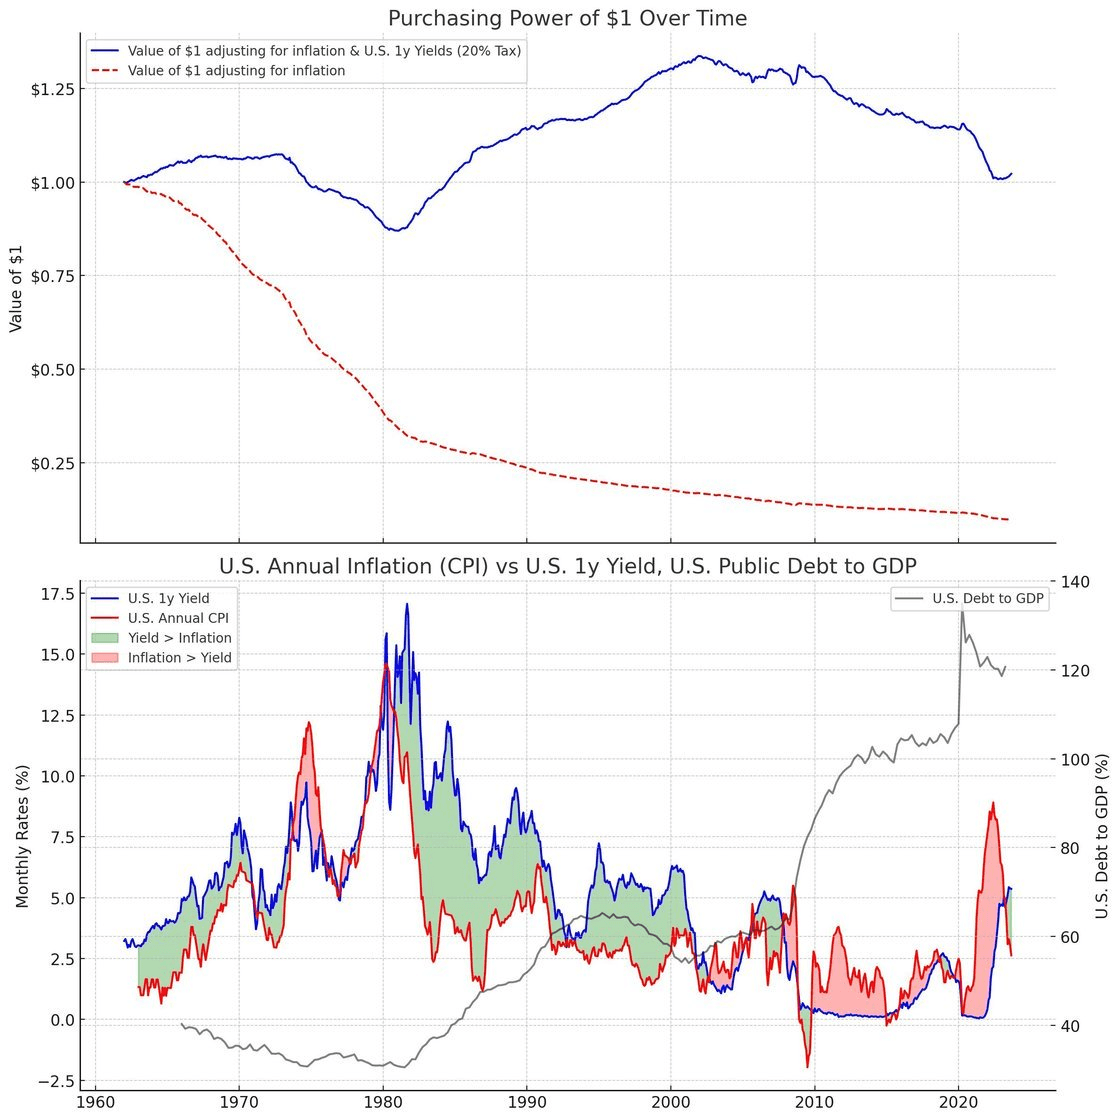
The difference between the two figures is far less when you factor in an approximate 20% tax rate into the adjustment to yield payments, but it’s shown that since 1962, $1 has maintained it’s purchasing power? How can this be? Are hard money proponents intentionally deceiving their audience with false notions? Hardly, and let’s dive further into it.
Let’s break down the data into two distinct eras.
From 1962 to 2009, the average annual inflation was 4.40%, yet 1-year Treasury yields averaged 6.22%, resulting in real gains in purchasing power. However, from 2009 to the present, we’ve seen an average annual inflation of 2.34% against 1-year Treasury yields of just 1.00%, causing real losses in purchasing power.
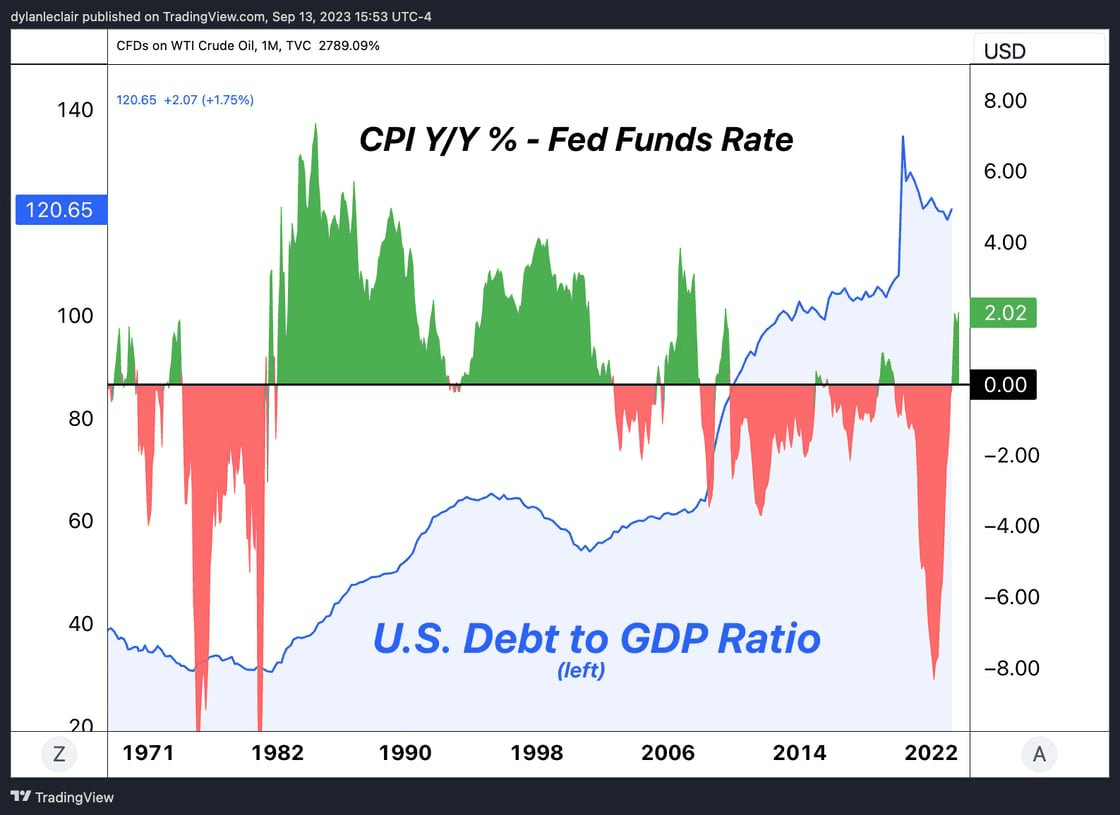
Why single out 2009 as a turning point? In the past, the U.S. could offer positive real yields thanks to a robust balance sheet, favorable demographics, and global GDP growth. Now, with a Debt-to-GDP ratio exceeding 100% and other growth factors slowing down, positive real yields are becoming untenable.
The Wealth Gap and Polarization
Let’s not forget that the average American, who often doesn’t have excess capital to save or invest, is left behind during inflation, while the investor class can outpace it through positive real yields or invest in equities and alternate assets outside of fixed income when real yields are negative.
This widens the wealth gap and contributes to the polarization we’re witnessing today. With high Debt-to-GDP ratios, expect the post-2009 trend to hold, regardless of any short-term tightening cycles. By this, we mean that real debt burdens are still far too high, and the only way to “solve” such problems is through sustained high inflation.
A More Realistic Assumption
Lastly, for the sake of the argument, we adjusted post 1990 CPI to be 120% of the reported value. One could even make the claim that this over-adjustment is not enough, and that actual inflation in their daily life is much higher than even this, which we cannot refute.
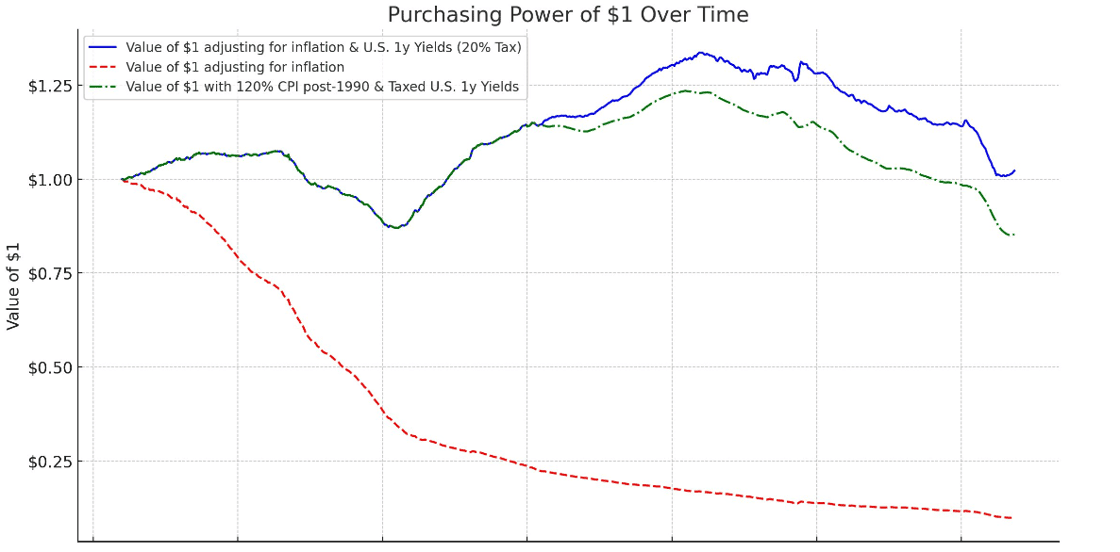
The reality remains the same, however. A fiat system characterized by perpetual currency devaluation results in a two-tiered society that further bifurcates by wealth and class the longer the system persists. The system can maintain the illusion of solvency and stability so long as interest rates and relative debt burdens are at manageable levels.
However, the system becomes increasingly unstable as debt burdens balloon, leaving the central planners no choice but to accelerate inflation and currency debasement to reset the board and lower relative debt burdens back to manageable levels. But don’t just take our word for it; the International Monetary Fund laid out this playbook back in 2015.
Final Note
With relative global debt burdens still at or past levels that historically lead sovereign nations to default, expect politicians and central bankers to do everything in their power to distract you from what actually needs to happen. Setting aside the current tightening cycle—which paradoxically accelerates the debt spiral through skyrocketing interest expenses—suppression of interest rates relative to levels of debasement/inflation will be the norm on average. This will continue until debt burdens have been significantly reduced, requiring either a miraculous boom in productivity or further inflation.
Bitcoin and other assets not susceptible to arbitrary debasement will emerge as massive winners.
Podcast of the Week
For this week’s episode of The Last Trade, hosts Marty Bent, Jesse Myers, and Michael Tanguma were joined by Loren Asmus from Canterbury Consulting, an institutional investment consulting firm providing portfolio advice to pensions, endowments, and similar institutional capital allocators. The conversation was a peek behind the scenes at what institutional capital allocators are really thinking about Bitcoin and how it can fit into their portfolios. The conclusion is that the institutions are coming to Bitcoin, and have already begun… it is just a slower and more gradual process than many would hope.
Check out the full episode here.
Closing Note
Wrapping up this week’s digest, Onramp Bitcoin invites you to explore our offerings on our website.
With an industry-leading multi-party custody solution, Onramp allows Bitcoin withdrawals without triggering a taxable event. Onramp stands as an optimal solution for HNWI and institutions seeking Bitcoin exposure prior to transitioning to self-custody.
If Onramp’s offerings align with your needs, or those of someone you know, feel free to schedule a chat with us here.
Onward and Upward,
Dylan LeClair