October 16, 2026 Roundup: Arithmetic Always Wins

Brian Cubellis | Chief Strategy Officer
Free. Every week. One story that matters, read all the way down.
Policymakers can slow the repricing of scarce assets for a while, but fifty years of history say they can’t stop it.
Bitcoin peaked near $126,000 in October of last year. By the end of June it had given back more than half, bottoming near $57,800. Gold followed a few months behind. It fell from a record near $5,600 in late January to below $4,000 by late June.
Over the same stretch, the money supply kept setting records and the deficit ran to roughly $2 trillion. Interest on the debt passed $1 trillion, and inflation started climbing again. On the surface, the assets built to protect against debasement fell hardest just as debasement picked up speed.
That looks like a contradiction until you look at how these episodes have played out before. The underlying story is arithmetic. Deficits compound, the debt grows faster than the economy, and the easiest way to carry that debt has always been more money creation.
Scarce, neutral assets like gold and bitcoin price that reality over the long run. Over shorter periods, they trade on the price of fiat money: interest rates, real yields and the dollar. Policymakers pull exactly those levers when they want to slow the repricing down. Their tools are rate hikes, balance sheet runoff, sales of official reserves and jawboning.
These fights tend to unfold in three acts. In act one, the scarce asset runs. In act two, policymakers fight back with those tools, and it works for a while. In act three, the cost of the fight runs into the size of the debt. Policy reverses, and the asset reprices higher than before.
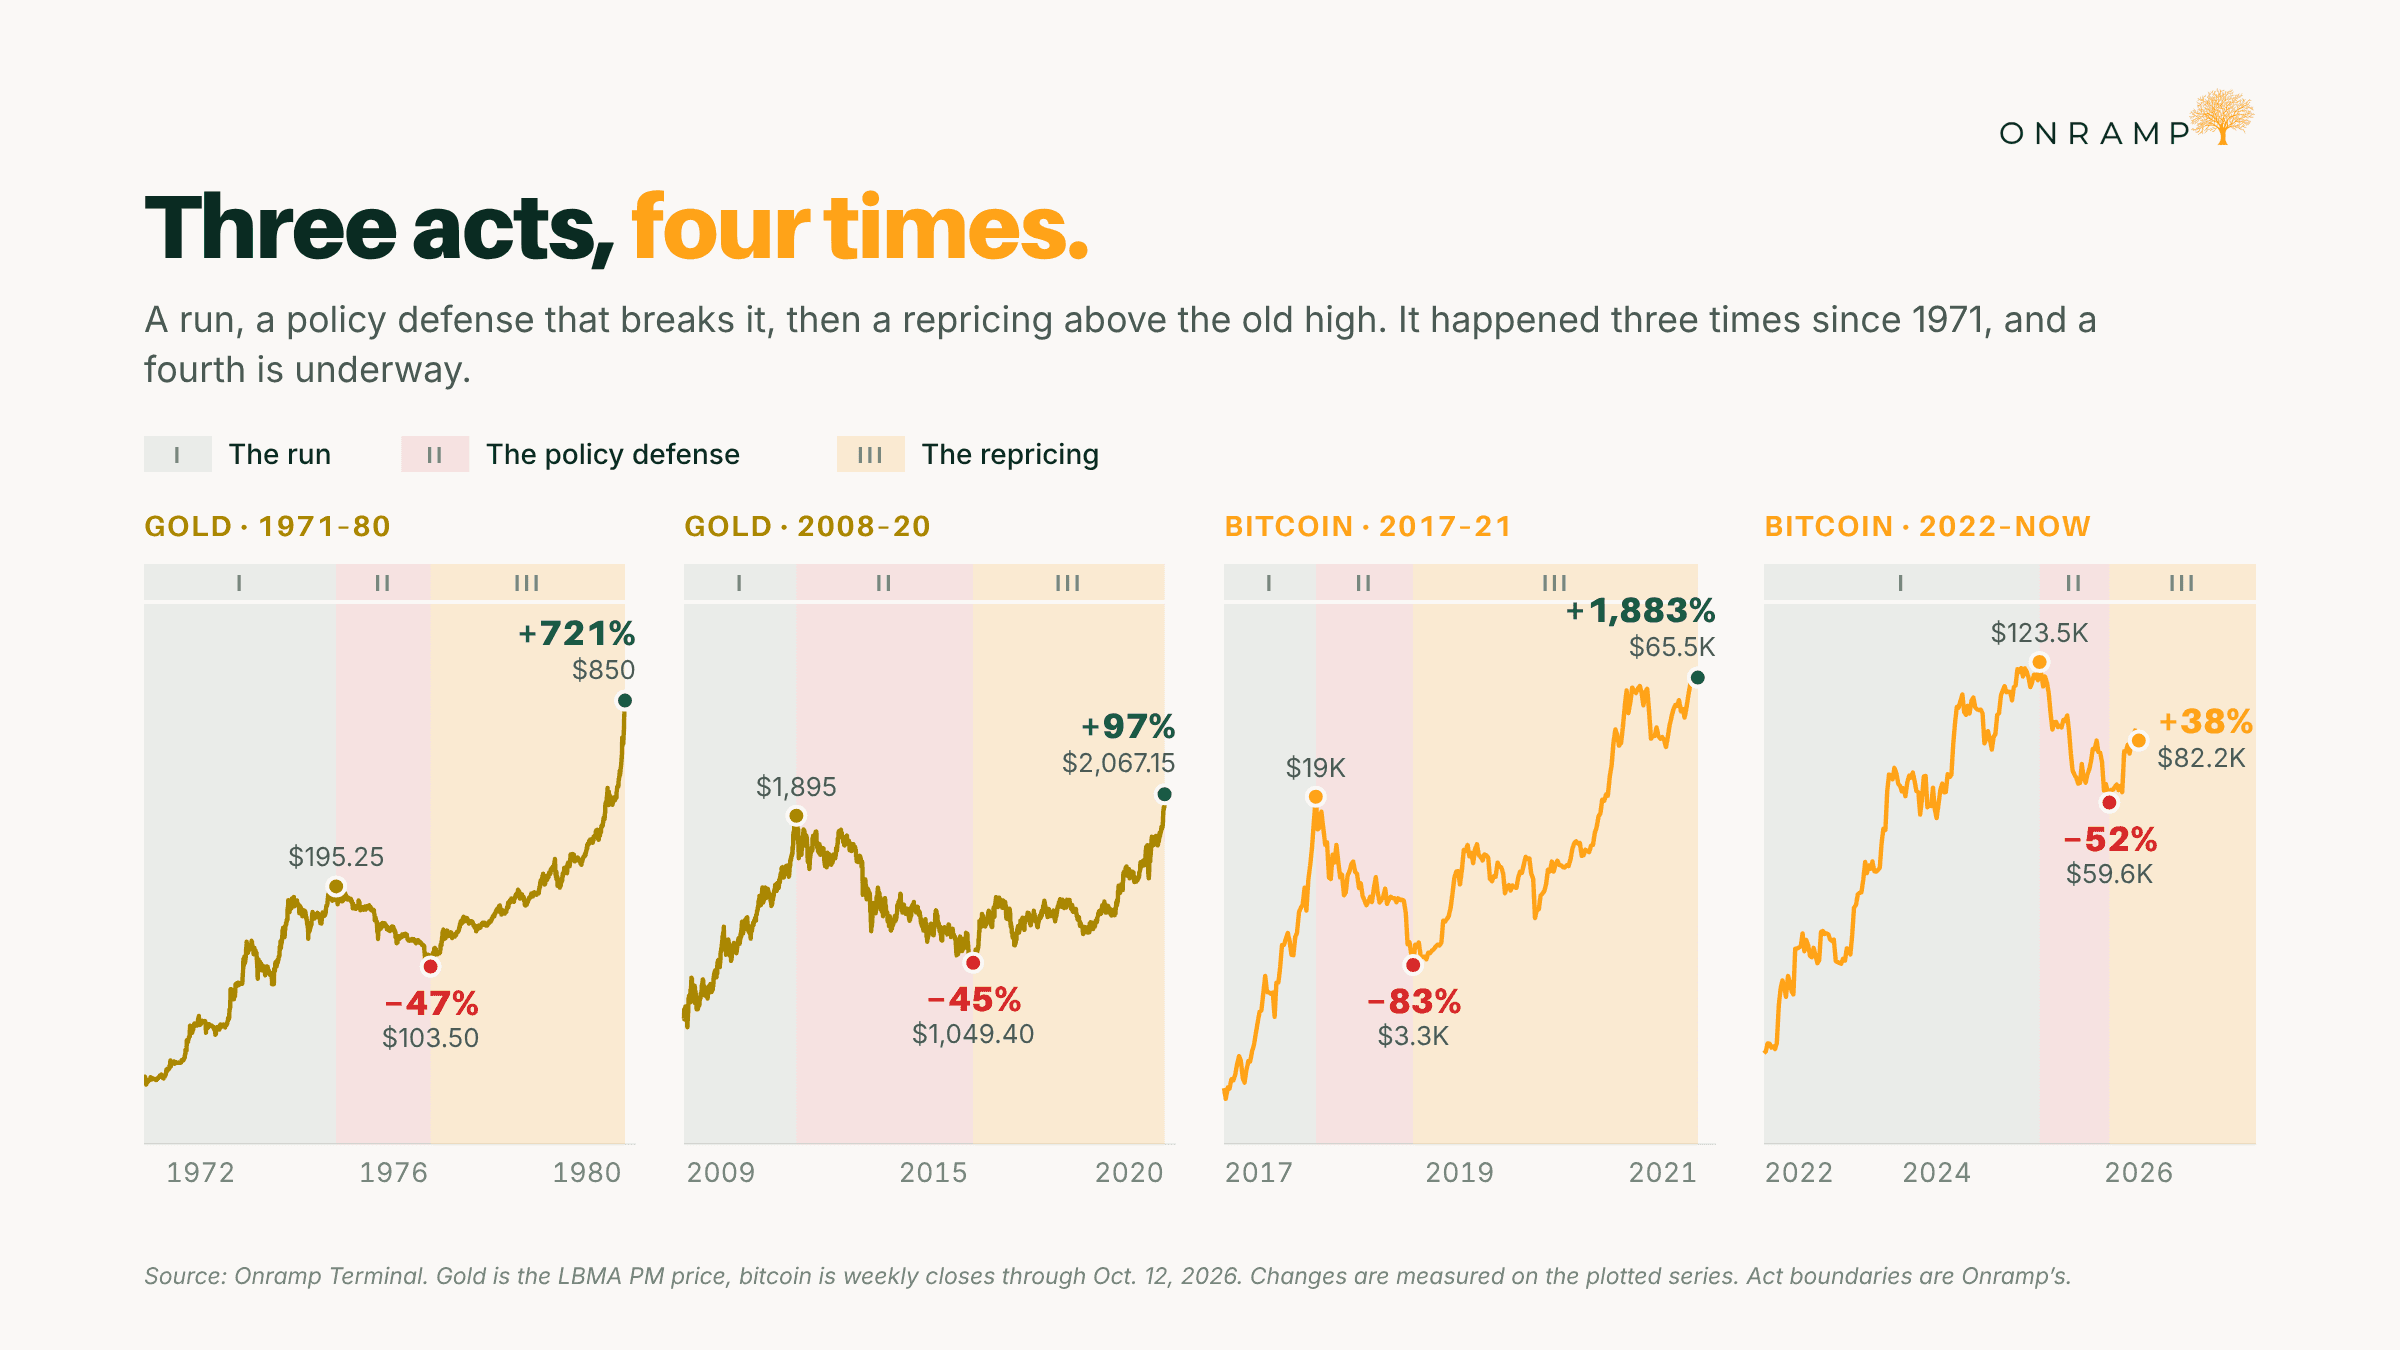
This has happened three times in the past fifty years. We are early in the third act of a fourth. This time, the main tool being used against the math is making the math worse.
The arithmetic
Every inflationary stretch comes with a ready explanation, and this year has supplied several, from the war with Iran and oil above $100 to an AI buildout bidding up power, chips and capital. Shocks like these move relative prices. A broad, persistent rise in the price level requires more money, and the system has produced more money steadily since 1913.
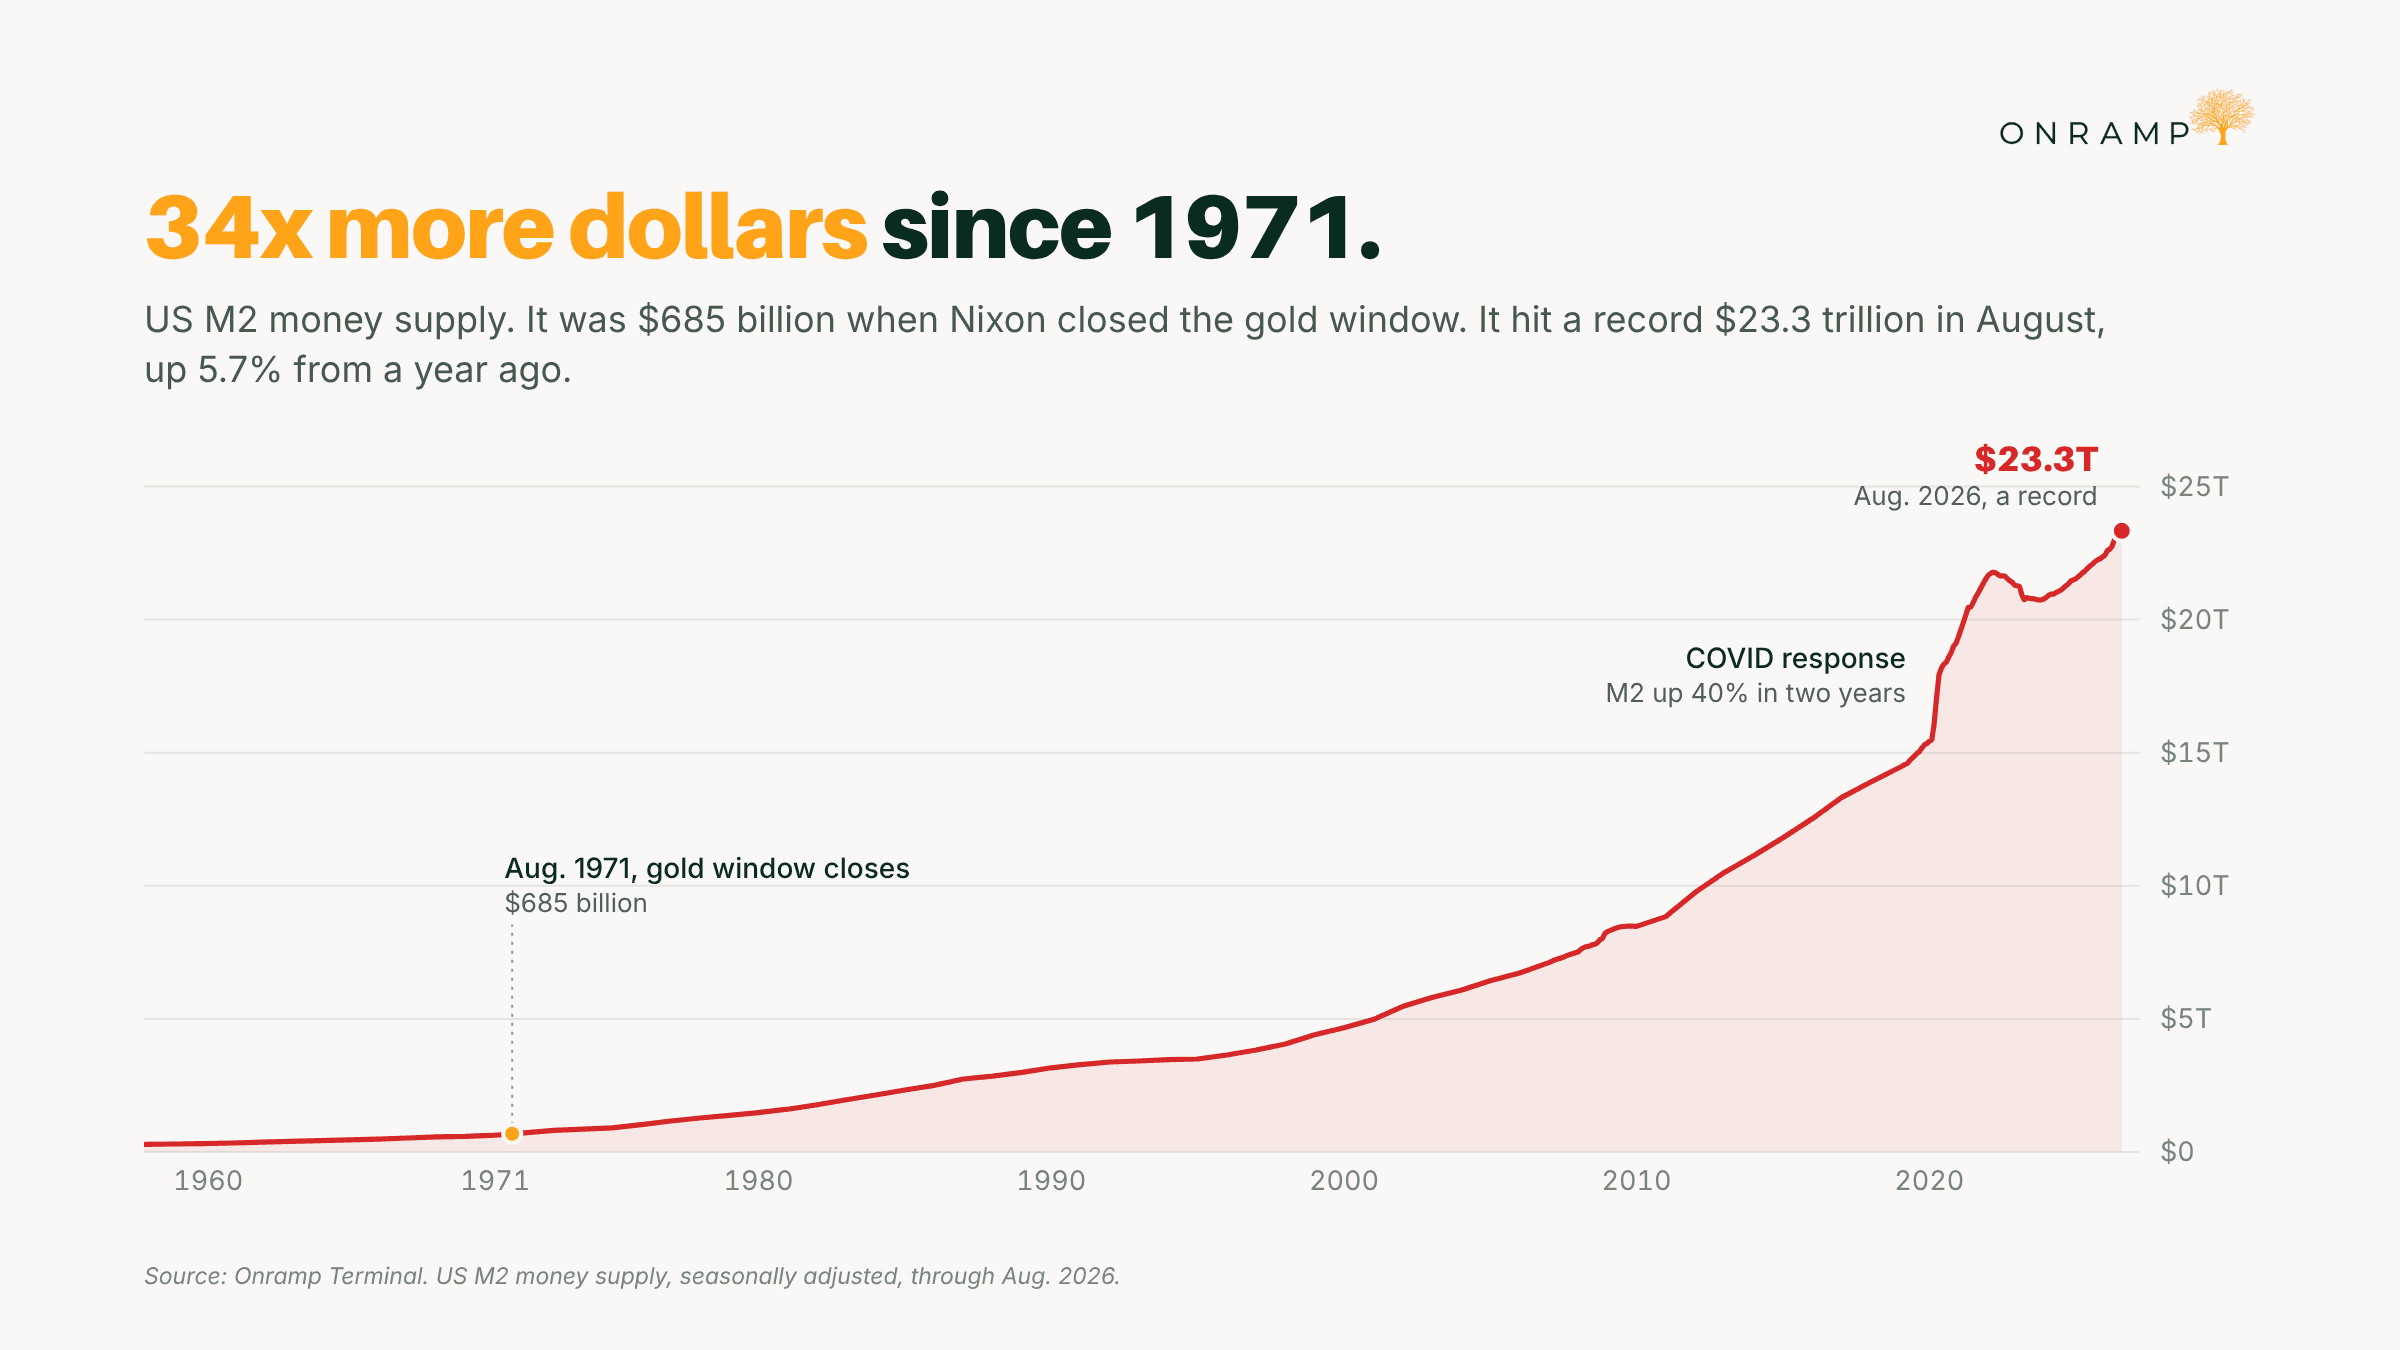
The dollar has lost roughly 97% of its purchasing power since the Federal Reserve was created. Most of that loss came after 1971, when Nixon closed the gold window and removed the last external limit on issuance. M2 stood at roughly $685 billion that year. In August it reached a record $23.3 trillion, about 34 times larger, and it is growing 5.7% a year.
Crises tend to set the pace. Wars, financial panics and pandemics each arrive with a justification for spending and money creation that would never clear in normal times, and that money rarely comes back out.
The response to COVID grew M2 by roughly 40% in about two years. It also took the Fed’s balance sheet from about $4 trillion to nearly $9 trillion. The war with Iran is being paid for with borrowed money, in a year when the deficit is already near $2 trillion. Whatever the event, the money supply comes out the other side permanently larger.
Three times before
Gold, 1971 to 1980
- Act one (1971 to 1974): With the gold window closed, gold ran from $35 to $195.
- Act two (1975 to 1976): After the Fed pushed rates above 13% in 1974, the Treasury and the IMF began auctioning gold into the market. Inflation fell by half, and by the summer of 1976 gold had dropped nearly 50% while the Fed chairman was taking credit for the progress on inflation.
- Act three (1976 to 1980): Inflation came back, and the second wave was bigger than the first. CPI peaked near 12% in 1974 and near 15% in 1980. The auctions couldn’t contain it, and gold reached $850 in January 1980.
Gold, 2008 to 2020
- Act one (2008 to 2011): At the end of 2008, as the Fed cut rates to zero and began buying bonds, gold traded near $840. It peaked at $1,921 in September 2011.
- Act two (2011 to 2015): Gold drifted lower through 2012, then broke in 2013 when the Fed began talking about tapering its bond purchases. The Fed ended those purchases in 2014 and delivered its first rate hike in December 2015. Real yields and the dollar rose, and gold fell to $1,046, even though the Fed’s balance sheet had grown to $4.5 trillion along the way.
- Act three (2016 to 2020): The Fed reversed course in 2019, and the pandemic response in 2020 dwarfed everything before it. Gold reached a new record of $2,075 in August 2020.
Bitcoin, 2017 to 2021
- Act one (2017): Bitcoin ran to roughly $20,000.
- Act two (2018): The Fed hiked four times, and Powell described the shrinking of its balance sheet as being on autopilot. Bitcoin fell to around $3,200 by December.
- Act three (2019 to 2021): The Fed paused in January 2019 and cut that summer. In 2020 it began the expansion that would take its balance sheet to nearly $9 trillion. Bitcoin reached $69,000 in November 2021.
The last two instances overlap because both third acts ran through the same policy reversal in 2019 and the pandemic response that followed.
The fourth time
Act one of the current cycle ran from late 2022 to the records. Bitcoin climbed from below $16,000 to near $126,000 in October 2025, and gold climbed from about $1,630 to near $5,600 in January.
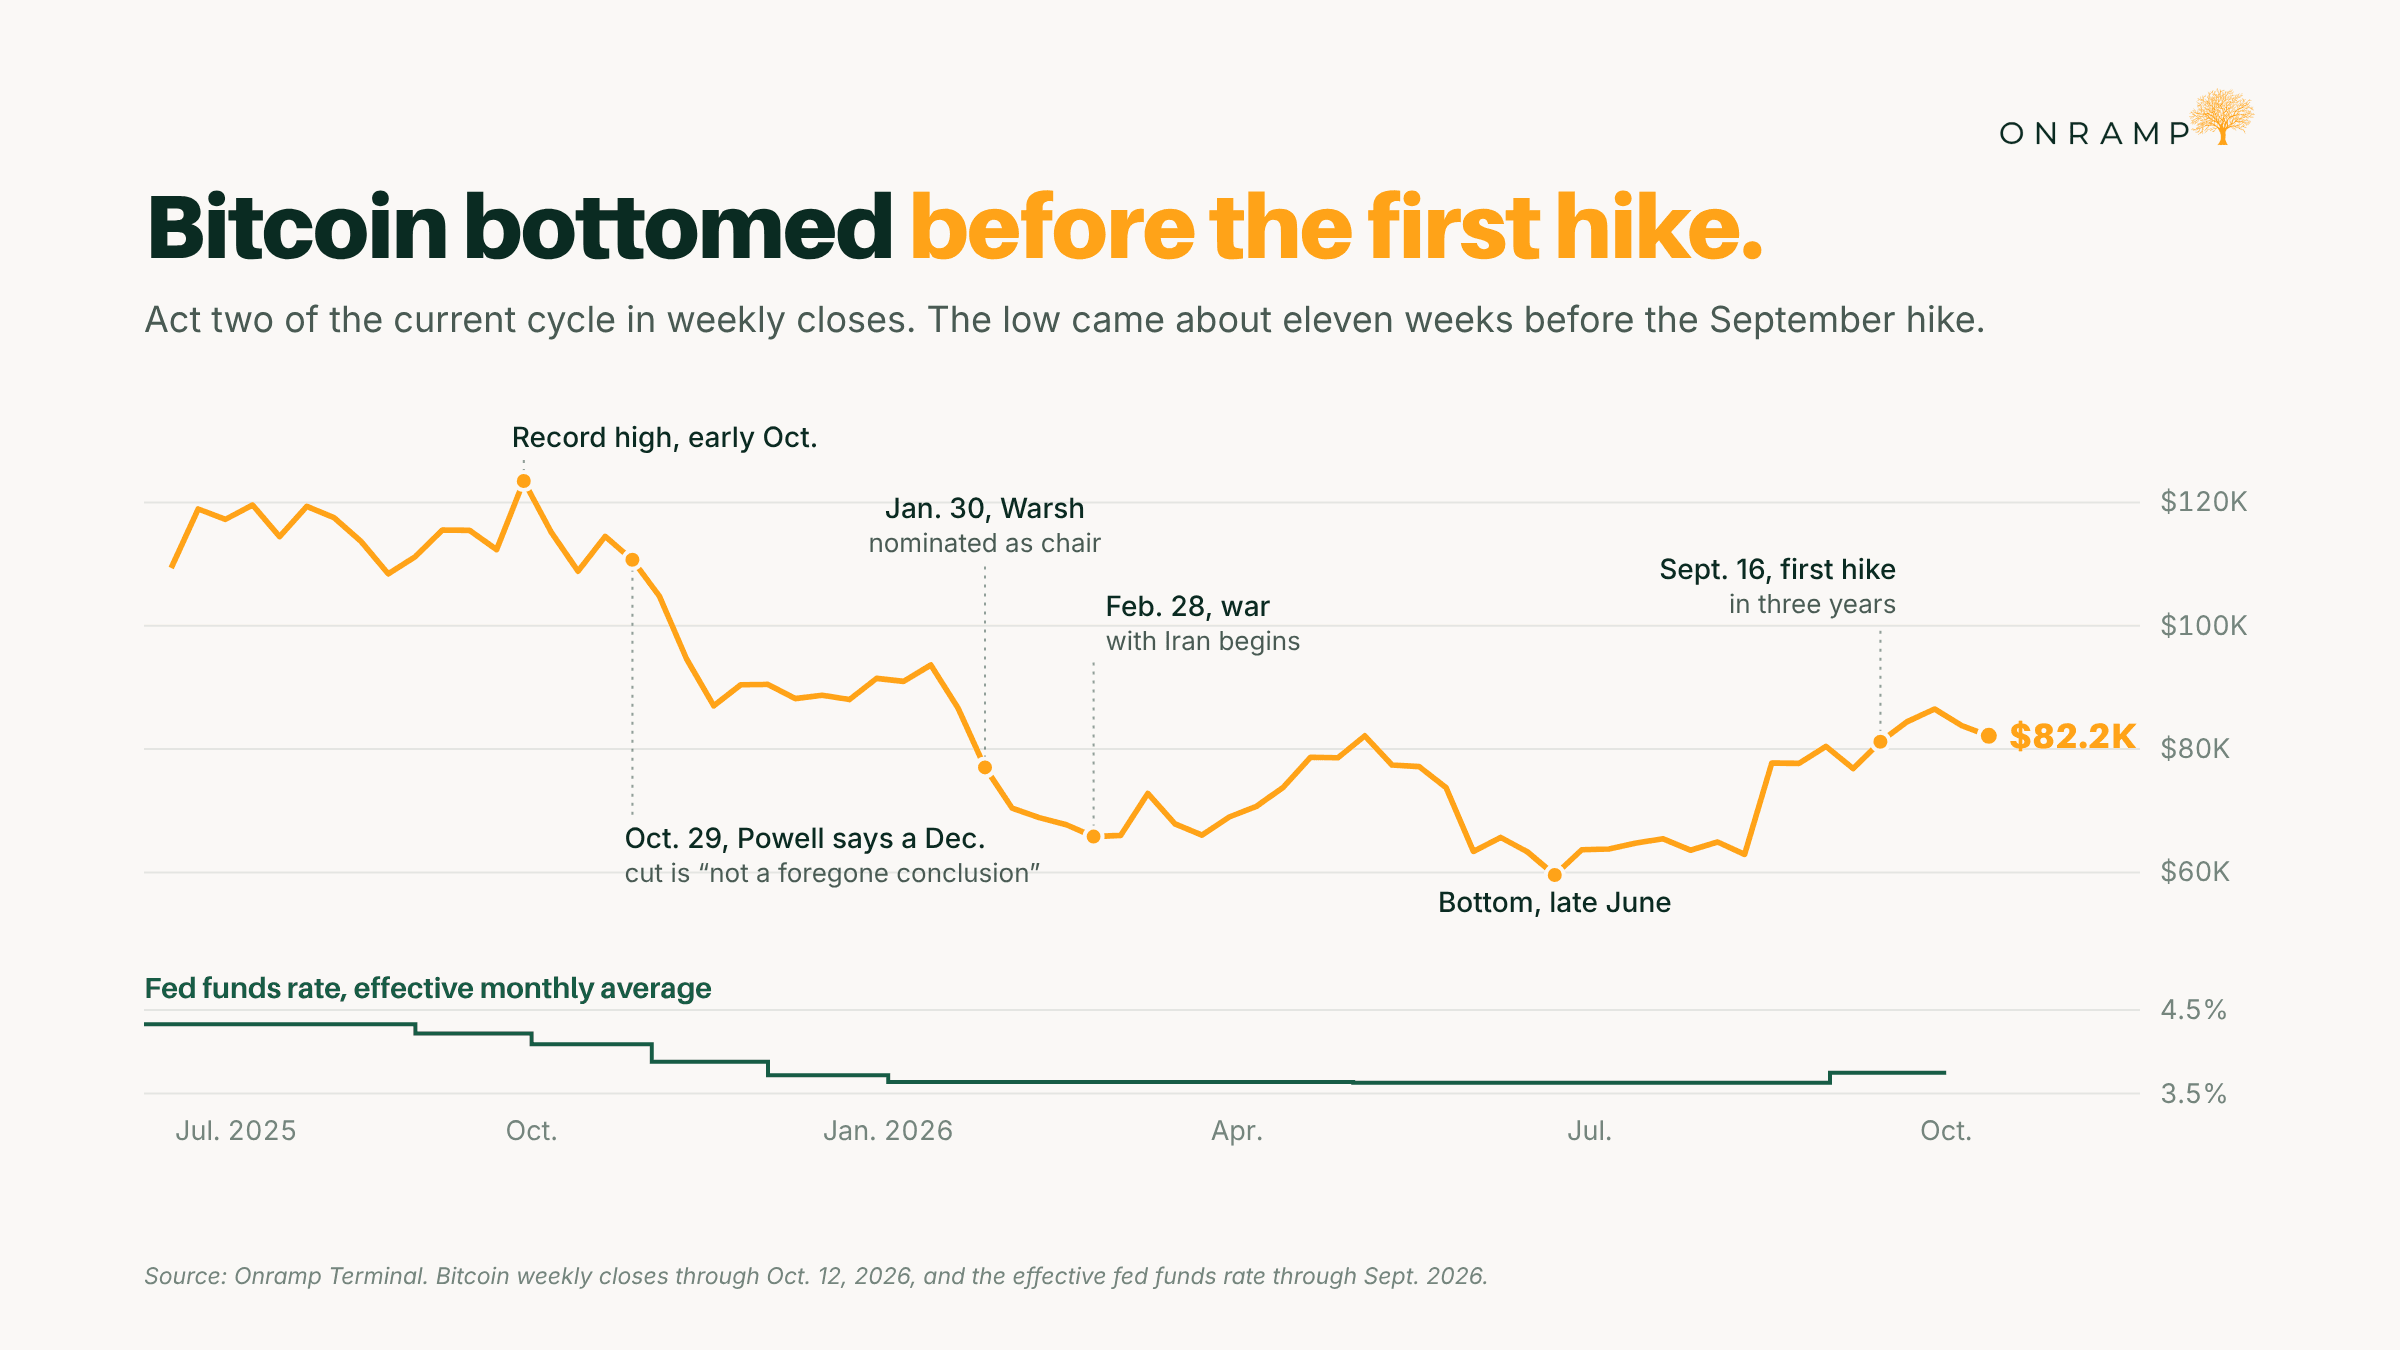
Act two started roughly a year ago. On October 29, 2025, Powell told markets a December cut was “not a foregone conclusion,” and bitcoin fell below $110,000 within hours. The Fed made one last cut in December and then stopped, holding rates from January onward.
On January 30, Kevin Warsh was nominated as chair. He is a known critic of the Fed’s large balance sheet, and gold had its worst day since the early 1980s, falling about 11%. The war began at the end of February. Inflation, which had peaked at 9.1% in 2022, started a second wave, and CPI climbed from 2.4% in January to 3.8% by April. The long bond later pushed to its highest yields since 2002. By late June, bitcoin had given back more than half of its peak and gold was down nearly 30% from its record. In September the Fed hiked for the first time in three years.
Act three appears to have begun in late June, when bitcoin and gold bottomed within days of each other. Bitcoin has led, rising about 40% from its low as spot ETFs took in roughly $6.3 billion over the third quarter. Gold has lagged. At around $4,130 it still trades about a quarter below its record, with the Fed still talking about another hike.
That pattern matches the prior cycles more closely than it might seem. In 2015, gold bottomed the same month the Fed raised rates, because markets price the end of tightening well before the central bank admits it.
Why this time is more constructive
The main tool now feeds the problem. The one time this cycle actually broke was the early 1980s. Volcker held real rates high enough, for long enough, to end gold’s run for two decades. That worked because federal debt was about a quarter of GDP, and the government could carry double-digit rates.
Incrementum’s In Gold We Trust report put it plainly this year: if Volcker held a bazooka in 1980, today’s Fed chair is clutching a water pistol. Interest on the debt now costs more than national defense.
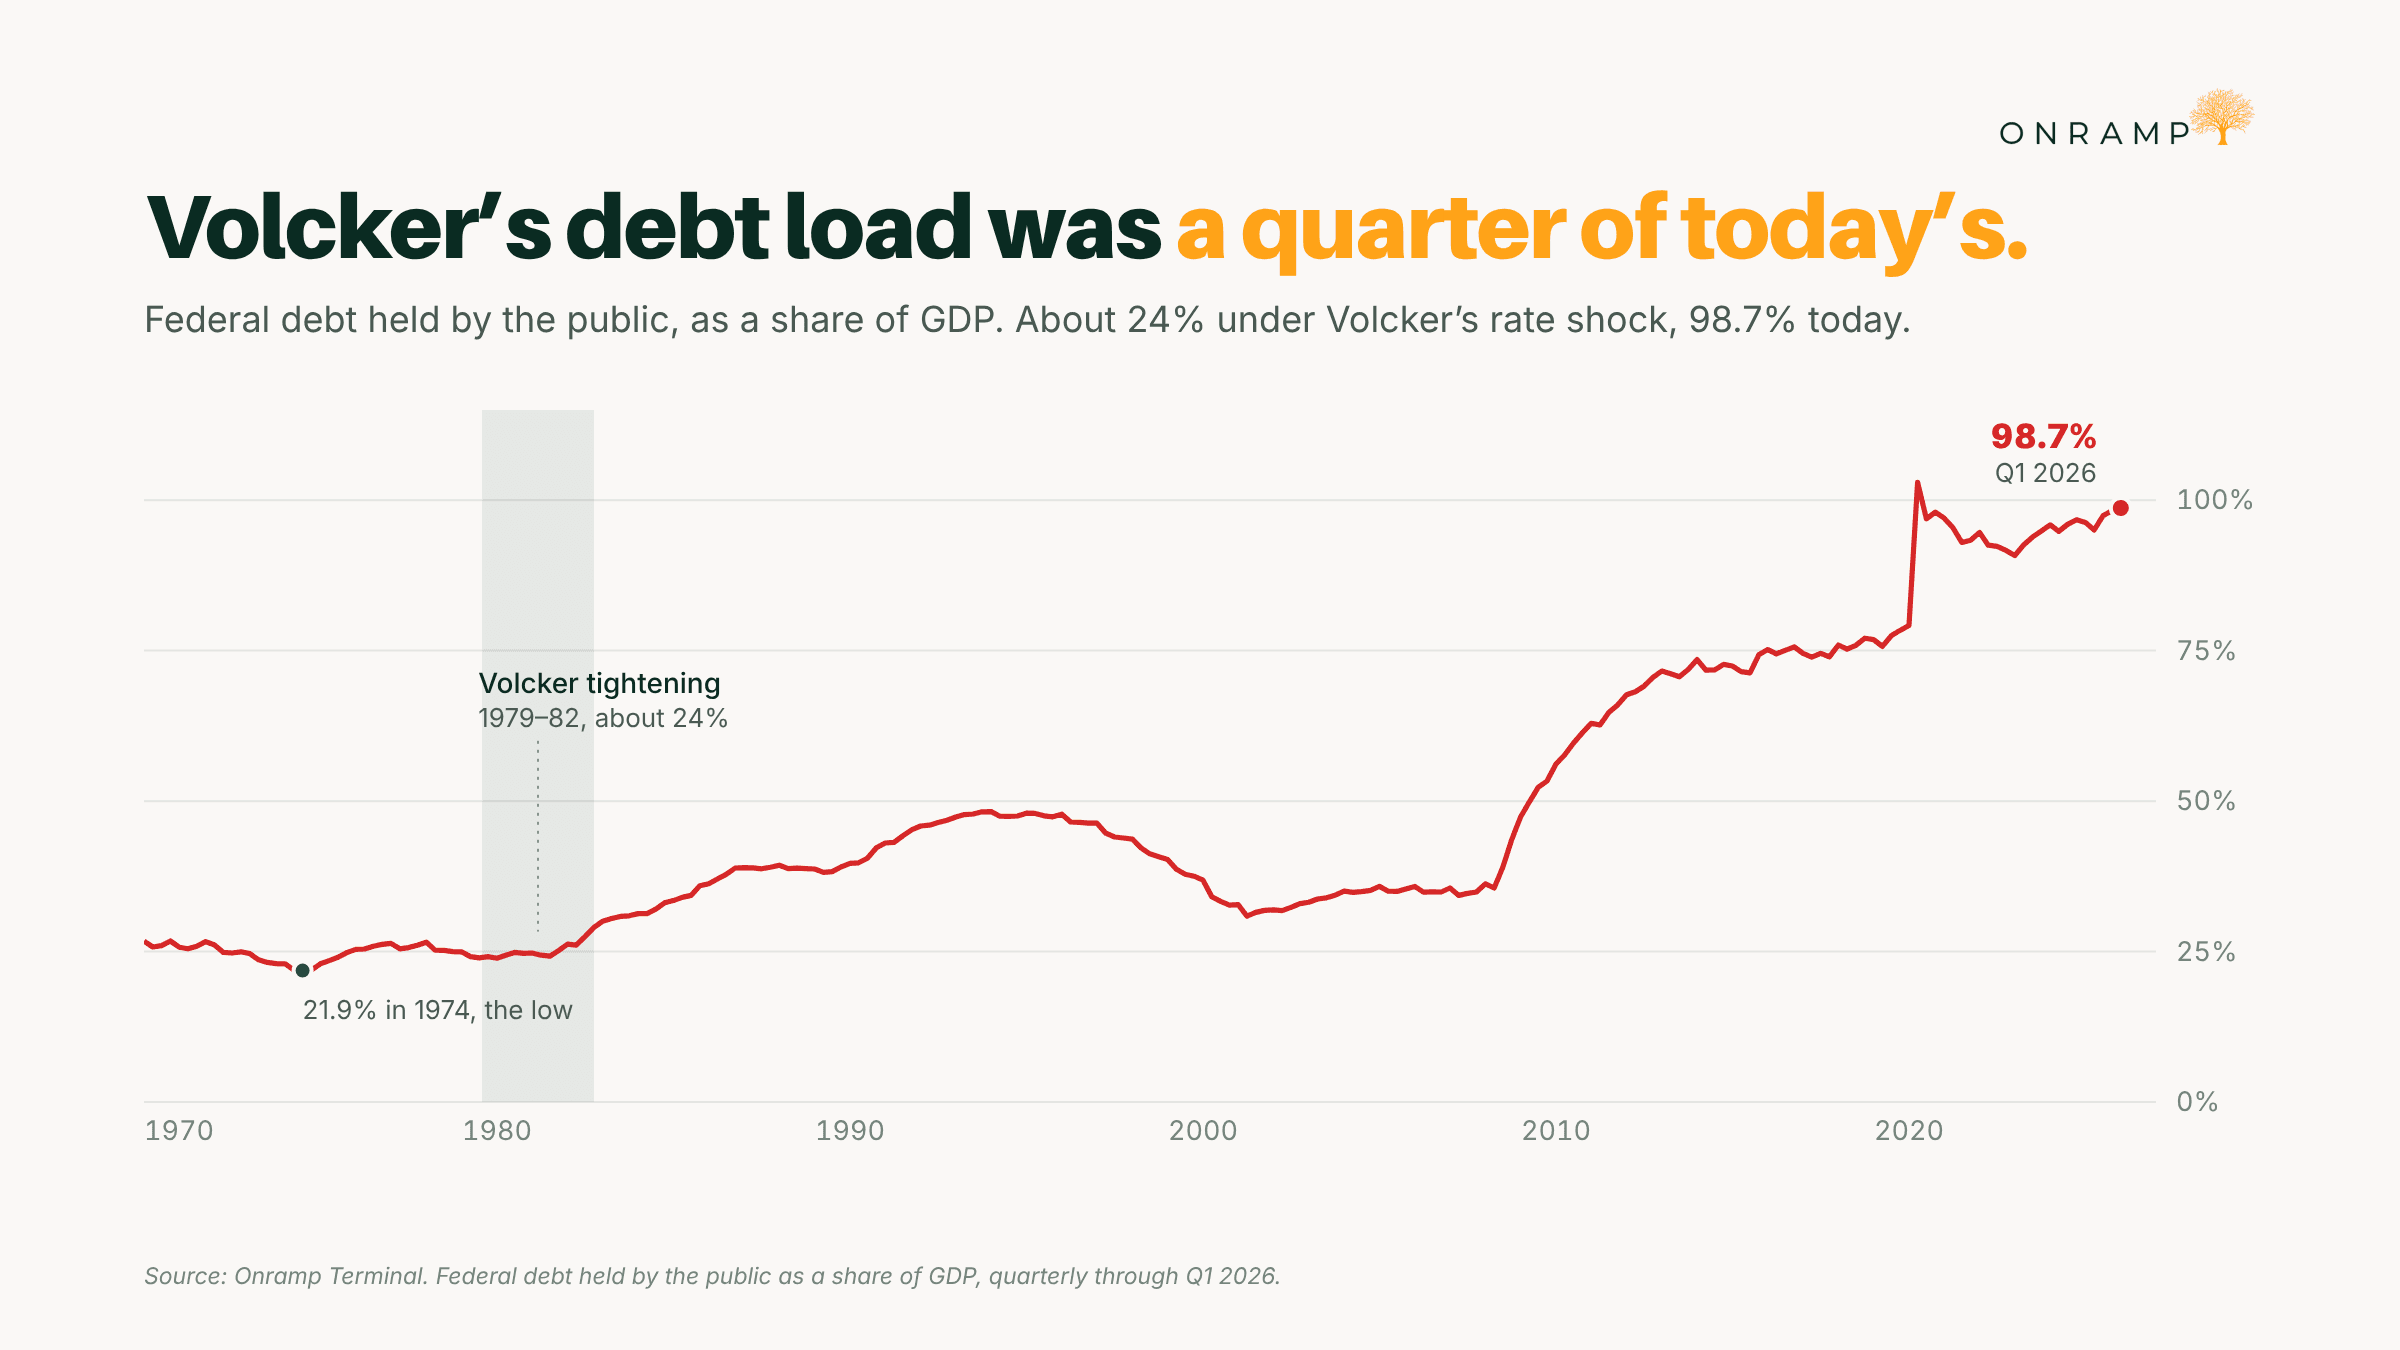
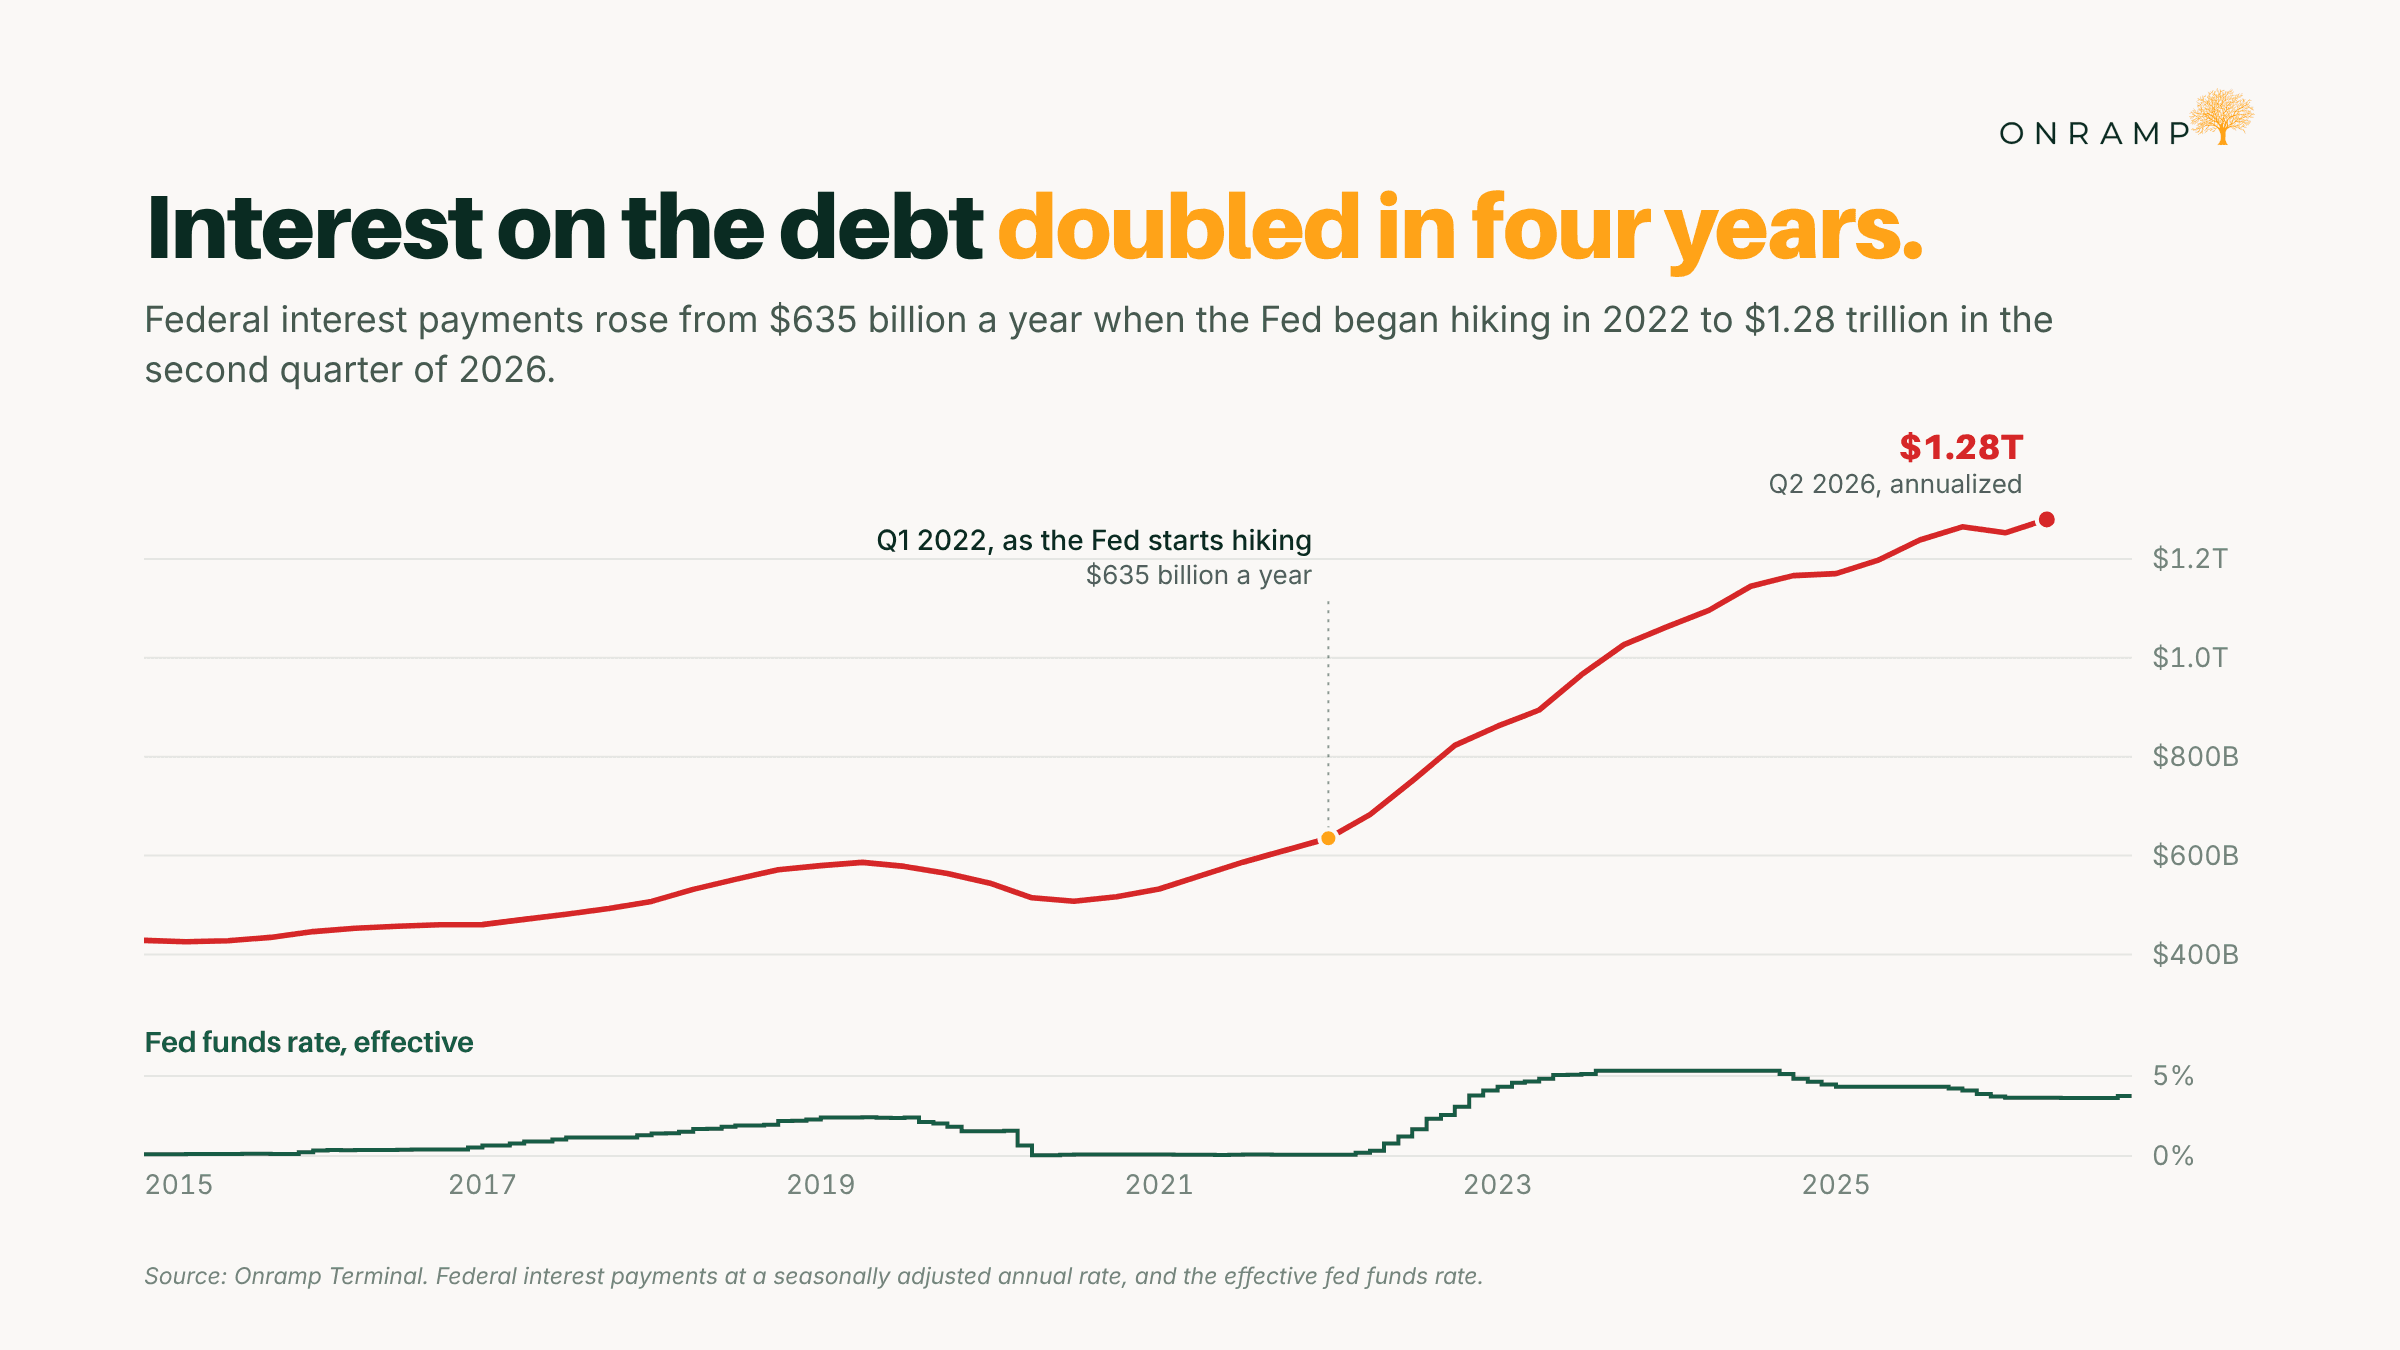
Today debt is roughly 100% of GDP, and about $10 trillion rolls over every year. Each hike adds to an interest bill that already exceeds $1 trillion, and that bill gets paid with more borrowing. The CBO’s own director has compared the feedback loop to a turbocharger. Rate hikes now expand the deficit they are supposed to discipline, which leaves very little runway for defending the currency. Wall Street’s shorthand for the policy mix, “run it hot,” reflects the same reality.
The official sector has gone from selling the hard asset to building the infrastructure to own it. In 1975 the Treasury auctioned its gold to defend the dollar. The global official sector has since flipped. Central banks bought more than 1,000 tonnes of gold in each of 2022, 2023 and 2024, and another 863 tonnes in 2025. From 2010 to 2021 they averaged 473 tonnes a year. They now absorb close to a quarter of annual mine supply.
In the US, this administration created a strategic bitcoin reserve. Its Treasury Secretary, a career macro trader who appreciates gold and bitcoin as store of value assets, has said the US will “monetize the asset side of the US balance sheet.”
The Clarity Act stalled in the Senate on September 15, and the agencies moved ahead without it. Two days later, the CFTC sent its own crypto market structure rules to the White House for review, and the SEC issued an innovation exemption. On October 1, the SEC also proposed rules giving investment advisers a clearer path to custody digital assets for their clients.
The banks are following. Morgan Stanley won preliminary approval from the OCC in June for its own digital asset trust bank. Schwab has been rolling out direct bitcoin trading to its brokerage clients, and Citi is building institutional custody. The officials of 1975 wanted the alternative to fail. Today’s are laying the groundwork for the entire financial system to hold it.
Bitcoin has no supply response. In 1975 the IMF could put 25 million ounces on the market, and gold miners answer higher prices with more production. Bitcoin’s issuance schedule doesn’t change for anyone. In a drawdown the only sellers are existing holders.
The holder base shows it. Each bitcoin bear market has been shallower than the last: 86% in 2014–15, 84% in 2018, 77% in 2022, and about 54% this time. When bitcoin fell 13% in a single day on February 5, in a sell-off that started with hedge funds cutting risk across the board, the spot ETFs still took in net inflows.
The third act
The lows in these cycles have tended to arrive before the tightening was over. Gold bottomed in December 2015, the same month as the first hike, and bitcoin bottomed in December 2018, days before that cycle’s last hike. This year bitcoin bottomed in June, about eleven weeks before the first hike of this cycle. Each time, the low came when the defense of the currency looked most credible and the case for scarce assets looked weakest.
That is roughly where we sit today. The Fed is still talking about another hike, the dollar just touched an 18-month high, and gold trades about a quarter below its record. The arithmetic underneath hasn’t moved. The debt is the largest it has been relative to the economy since the Second World War, each hike adds to an interest bill paid with more borrowing, and the officials who once sold scarce assets to defend the dollar are now building the system to hold them.
Policymakers usually win the second act. The one time they won the third, under Volcker, the government carried a quarter of today’s debt load. This time every hike makes the bill bigger.
Arithmetic always wins.
Closing Note
Onramp provides bitcoin financial services built on multi-institution custody. To learn more about our products for individuals and institutions, schedule a consultation to chat with us about your situation and needs.
Until next week,
Brian Cubellis